The EIA’s Short Term Energy Outlook (STEO) was published in early February. The chart below estimates World C+C by using the STEO forecast combined with past data from the EIA on World Output.
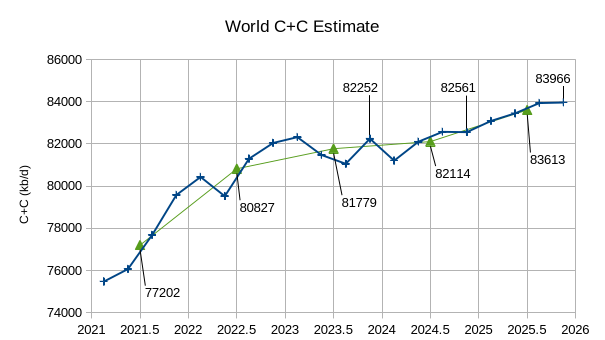
The World C + C estimate by the EIA has increased in the most recent STEO, especially for 2025 where average annual C+C output rises to 83613 kb/d, about 600 kb/d more than the centered 12 month average peak in August 2018 (83009 kb/d). Output increases by a relatively small amount in 2024 (335 kb/d for change in annual average output) and by a much larger 1499 kb/d from 2024 to 2025.
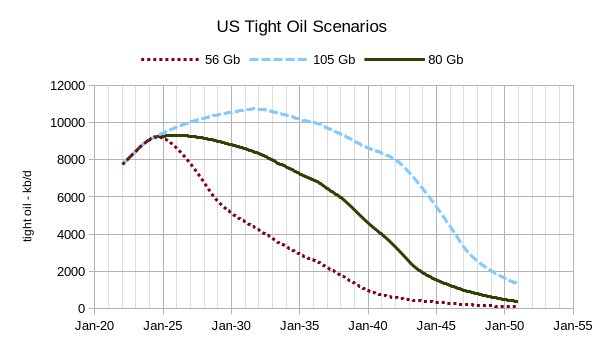
The scenarios above correspond roughly to the F95, mean, and F5 USGS assessments for US tight oil. Only the Permian Basin scenarios were modified the US tight oil minus Permian tight oil scenario is the same for all three scenarios. If the rest of US tight oil was modified to create a low and high scenario the URR would be reduced to 49 Gb for the low (56 Gb) scenario and increased to about 115 Gb for the high (105 Gb) scenario. The medium (80 Gb) scenario is my best guess for medium tight oil scenario, though any scenario between 49 Gb and 115 Gb is pausible depending on technology and price assumptions and assumptions about the level of technically recoverable resources. Note that about 27 Gb of tight oil has already been extracted and likely 40 Gb could be recovered with no new wells drilled (about 13 Gb of additional oil from wells that have already started development). The low scenario peaks in about 6 months at 9.2 Mb/d, the medium scenario in about 2 years at 9.3 Mb/d and the high scenario in 2031 at 10.7 Mb/d.
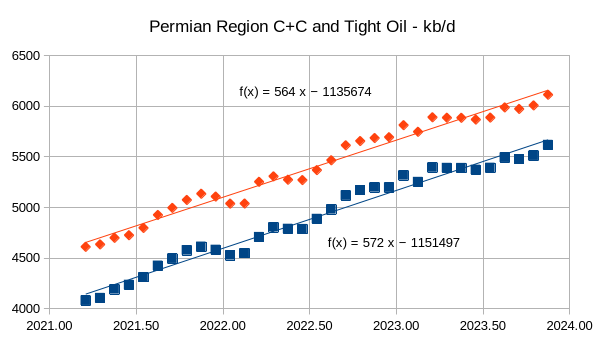
The chart above uses State data from Texas and New Mexico for the Permian region counties (upper line red diamonds) and also uses Novi labs, EIA, and State data to estimate Permian tight oil output (blue squares), the trend from March 2021 to November 2023 is nearly the same suggesting that conventional oil outut in the Permian basin has been nearly constant over this period at about 500 kb/d.
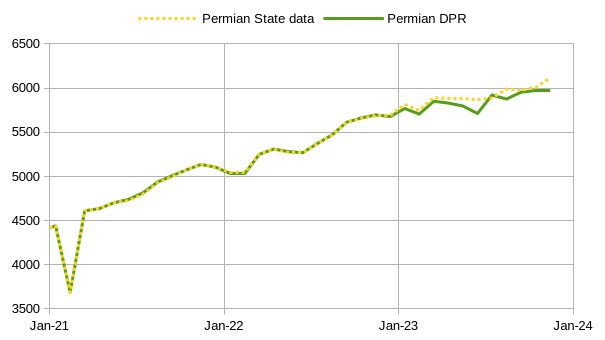
The chart above compares the Permian Region State Data with the Drilling Productivity Report estimate for the Permian region, the match is very good through the end of 2022.
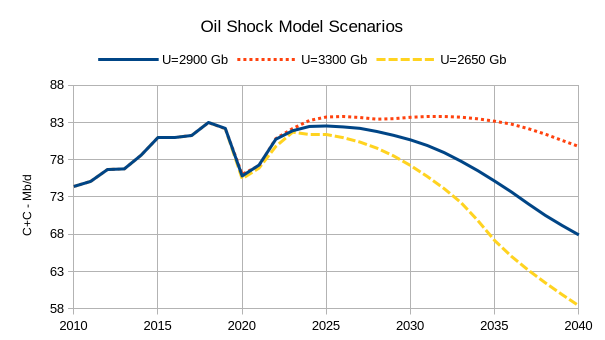
The chart above has three different Oil Shock Models. The high model with URR=3300 Gb assumes higher oil prices and a slow transition away from oil use for land transport which leads to higher unconventional oil output (tight oil and extra heavy oil), the medium model has similar levels of conventional output as my recent best guess models, and the low model assumes a lower level of conventional recoverable resources (2500 Gb rather than the usual assumption of 2800 Gb). My guess is that the probability that World C+C output falls between the low and high scenario is roughly 80% with about a 10% probability that the output path will be above the high scenario or below the low scenario. The middle scenario represents my best guess with an equal probability the output path will be above or below that scenario.


