By Ovi
Below are a number of Crude plus Condensate (C + C) production charts, usually shortened to “oil”, for oil producing countries. The charts are created from data provided by the EIA’s International Energy Statistics and are updated to October 2023. This is the latest and most detailed/complete World Oil production information available. Information from other sources such as OPEC, the STEO and country specific sites such as Brazil, Norway and China is used to provide a short term outlook
World Oil Production and Projection

World oil production increased by 302 kb/d in October, green graph. The largest increase came from Canada and Kazakhstan with both adding 123 kb/d each.
This chart also projects World C + C production out to December 2025. It uses the February 2024 STEO report along with the International Energy Statistics to make the projection. (Red markers).
The red graph forecasts that World crude production in December 2025 will be 83,550 kb/d and is 1,030 kb/d lower than the November 2018 peak.
From November 2023 to December 2025, production is estimated to increase by 1,364 kb/d or an average of 59 kb/d/mth. Part of the big drop projected for January 2024 is associated with the expected drop in US January production due to bad weather.
Over and above the projection to 2025, keep in mind that OPEC + has close to 3,000 kb/d of cuts in reserve if required.
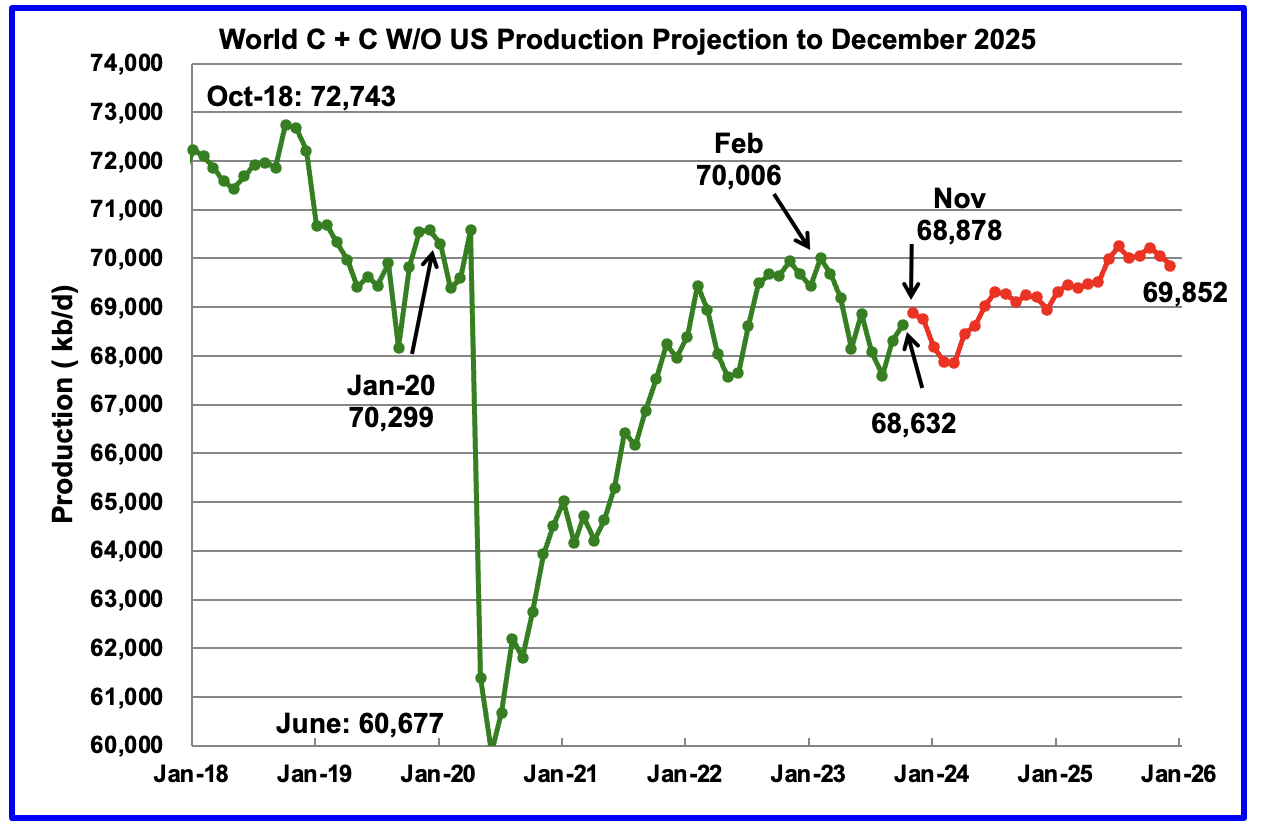
World without US October oil output increased by 304 kb/d to 68,632 kb/d. November is expected to add 246 kb/d to 68,878 kb/d.
Note that December 2025 output of 69,852 kb/d is lower than February 2023.
World oil production W/O the U.S. from November 2023 to December 2025 is forecast to increase by a total of 974 kb/d.
A Different Perspective on World Oil Production
Instead of dividing the World oil producing countries into OPEC countries and Non-OPEC countries, this section divides the countries into two groups on the basis of their production capacity. The division will be The Big Three, US, Saudi Arabia and Russia, and the Rest, i.e. the World oil producers W/O the Big 3. The top producer in the Rest, currently Canada, produces close to half of the lowest producer in the Big Three.
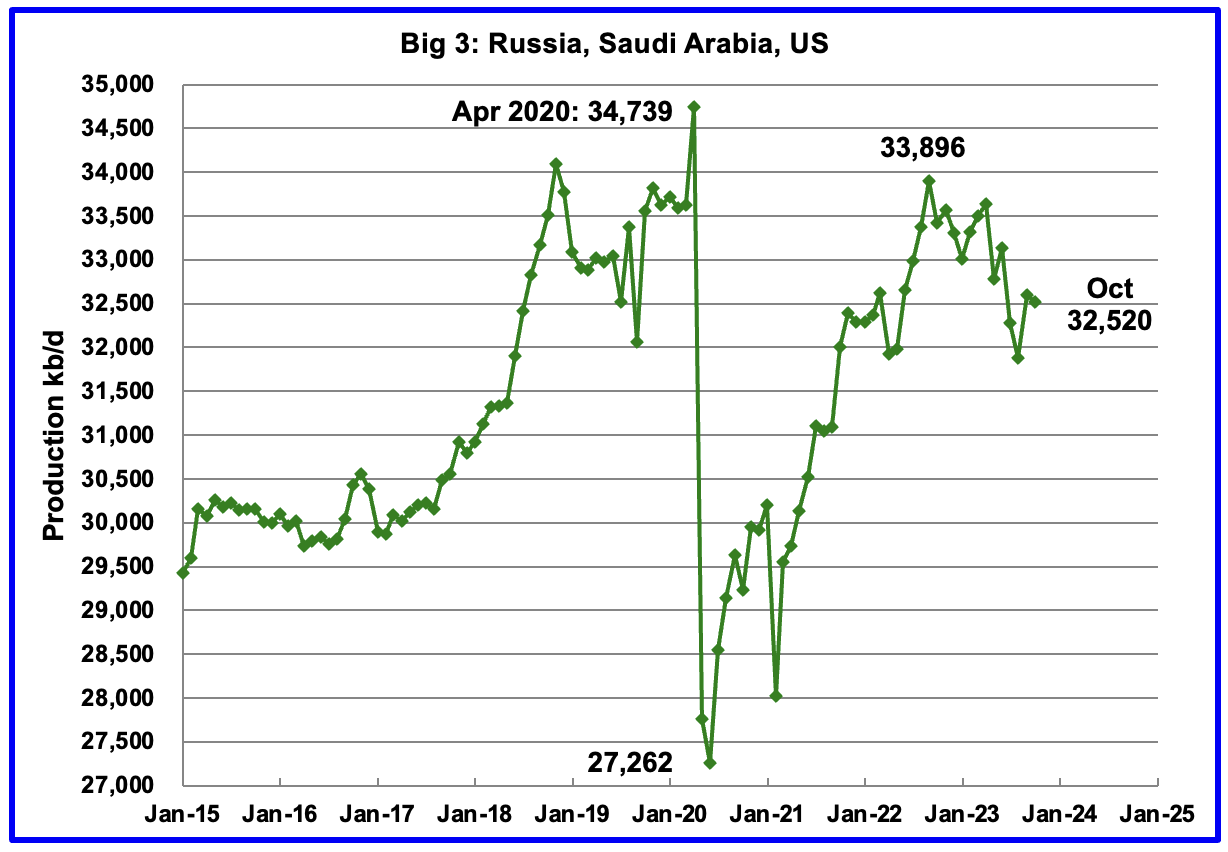
Peak production in the Big 3 occurred in April 2020 with a rate of 34,739 kb/d. The peak was associated with a large production increase from Saudi Arabia. Post covid, production peaked at 33,896 kb/d in September 2022. The production drop since then is due to cutbacks in Russia and Saudi Arabia.
October production from the Big 3 decreased by 74 kb/d to 32,520 kb/d.
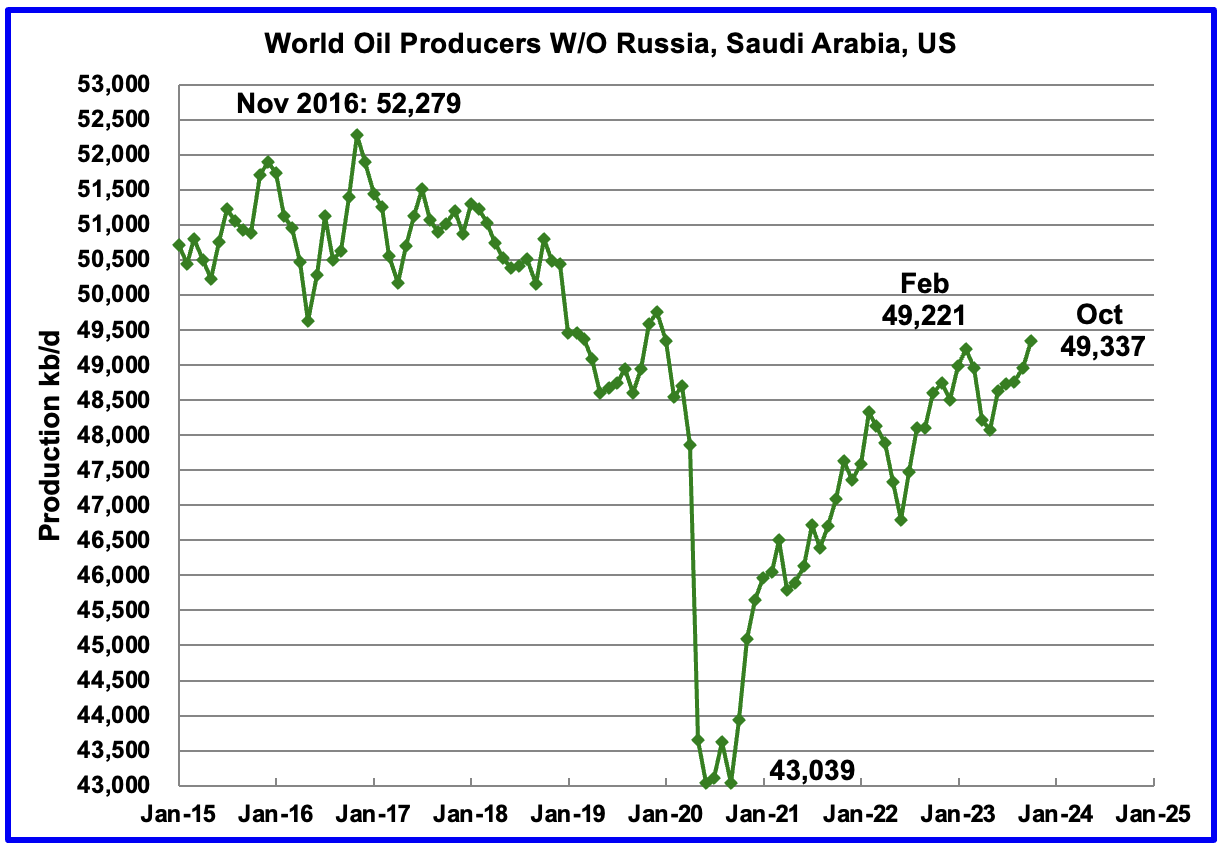
Production in the Rest has been slowly increasing since the low of September 2020 at 43,039 kb/d. In February 2023 production rose to a post covid high 49,221 kb/d. Output in October was 49,337 kb/d, an increase of 375 kb/d over September and exceeding the February 2023 high by 116 kb/d.
Production is down 2,942 kb/d from November 2016.
World Oil Countries Ranked by Production
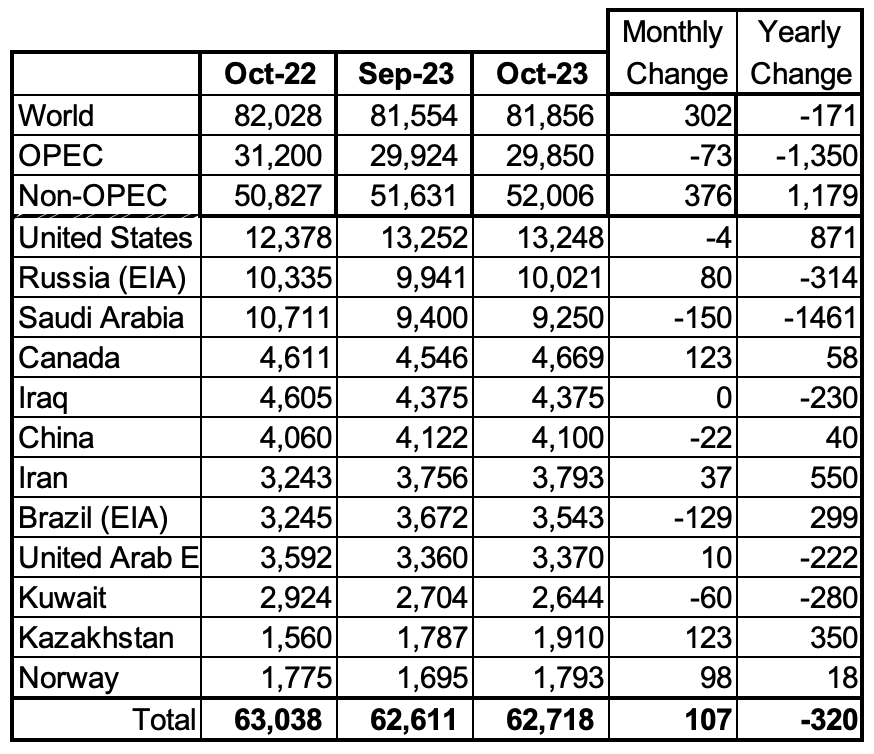
Above are listed the World’s 12th largest oil producers. In October 2023, these 12 countries produced 76.6% of the world’s oil. On a MoM basis, these 12 countries increased production by 107 kb/d while on a YOY basis, production dropped by 320 kb/d. On a YoY basis, note how the size of the Saudi Arabia production drop overshadows the US increase.
Non-OPEC Oil Production Charts

October Non-OPEC oil production rose by 376 kb/d to 52,006 kb/d. The largest increases came from Canada and Kazakhstan.
Using data from the February 2023 STEO, a projection for Non-OPEC oil output was made for the period November 2023 to December 2025. (Red graph). Output is expected to reach 53,205 kb/d in December 2025, which is 774 kb/d higher than the December 2019 peak of 52,431 kb/d. The updated December 2025 output is close to 100 kb/d higher than reported in the previous world report.
From November 2023 to December 2025, oil production in Non-OPEC countries is expected to increase by 831 kb/d. According to the STEO, the major contributors to the increase are expected to be the US and Guyana.
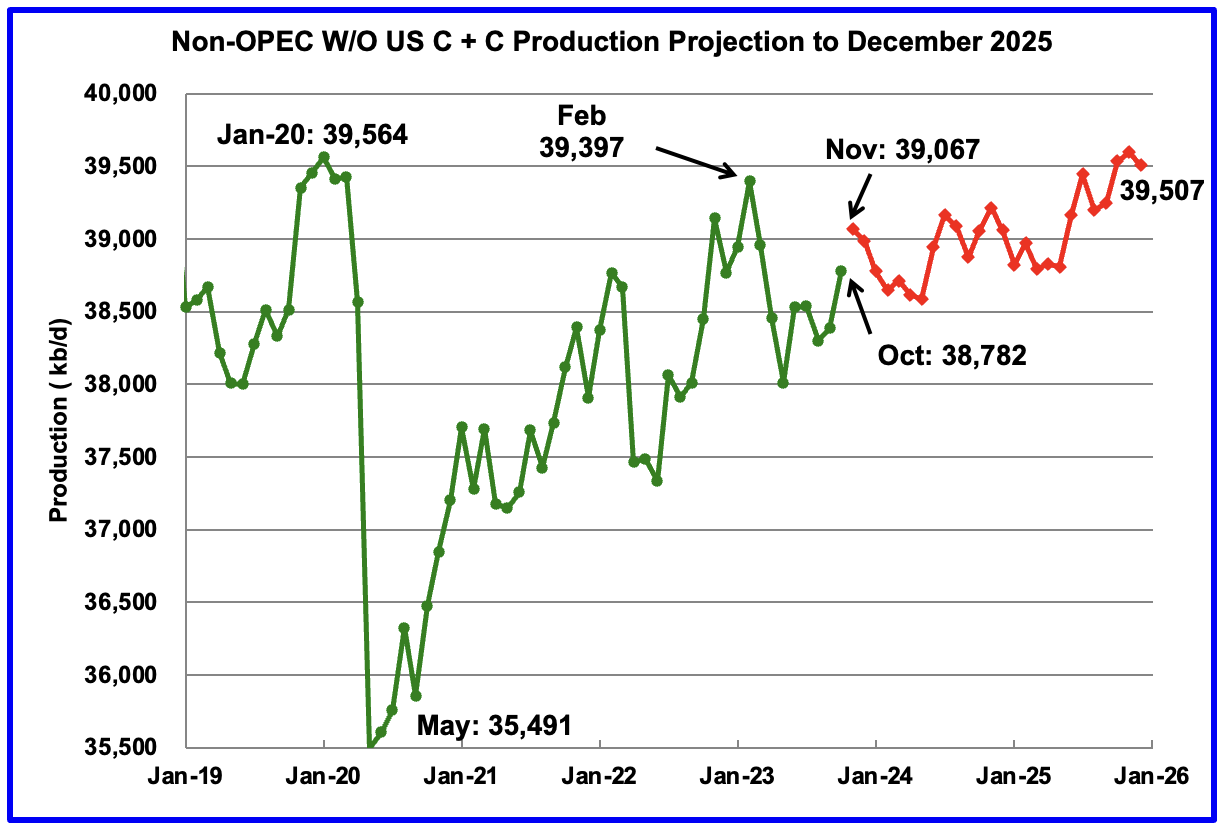
October Non-OPEC W/O US production increased by 298 kb/d to 38,782 kb/d. November production is projected to increase by 285 kb/d over October.
From November 2023 to December 2025, production in Non-OPEC countries W/O the US is expected to increase by 440 kb/d.
Note that December 2025 output is 110 kb/d higher than the February 2020 high of 39,397 kb/d. It is also 57 kb/d lower than the pre-pandemic high of January 2020, 39,564 kb/d.
Non-OPEC Oil Countries Ranked by Production

Listed above are the World’s 10 largest Non-OPEC producers. The criteria for inclusion in the table is that all of the countries produce more than 1,000 kb/d.
October’s production increase for these ten Non-OPEC countries was 246 kb/d while as a whole the Non-OPEC countries saw a production increase of 376 kb/d.
In October 2023, these 10 countries produced 83.8% of all Non-OPEC oil production.
OPEC’s C + C production decreased by 73 kb/d MoM while YoY it decreased by 1,350 kb/d. World MoM production increased by 302 kb/d while YoY output decreased by 171 kb/d.
Non-OPEC Oil Production Charts
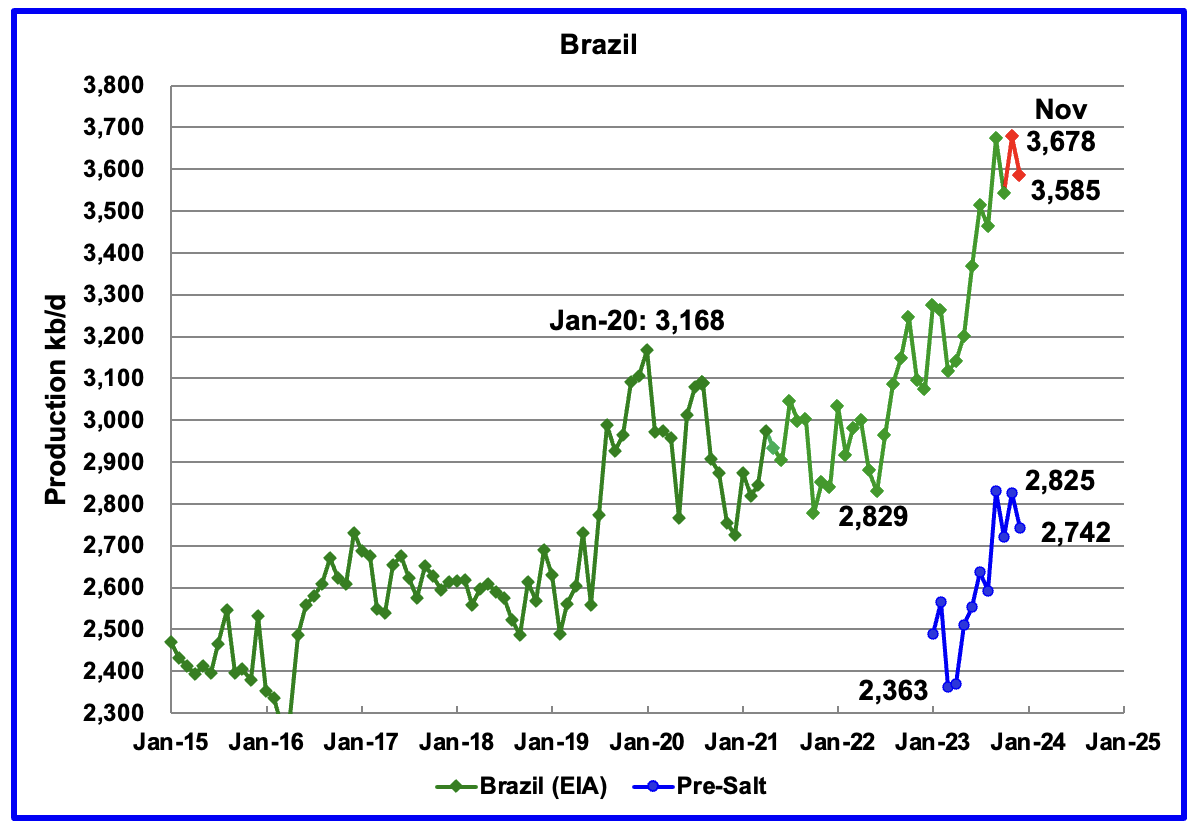
The EIA reported that Brazil’s October production decreased by 129 kb/d to 3,543 kb/d.
Brazil’s National Petroleum Association (BNPA) reported that output in November rebounded to 3,678 kb/d, a new high. December production dropped by 93 kb/d to 3,585 kb/d.
From March 2023 to November 2023, production increased by 563 kb/d. A similar rise in production is not expected in 2024. For 2024 the MOMR is expecting a smaller increase, closer to 100 kb/d while the EIA is forecasting flat output. The January MOMR also notes that : “increasing costs in the offshore market and inflation might also continue to delay projects and could temper growth in the short term.”
Production from Brazil’s off-shore “pre-salt” region has been added to this chart. November oil production increased by 103 kb/d to 2,825 kb/d while December dropped by 83 kb/d to 2,742 kb/d.
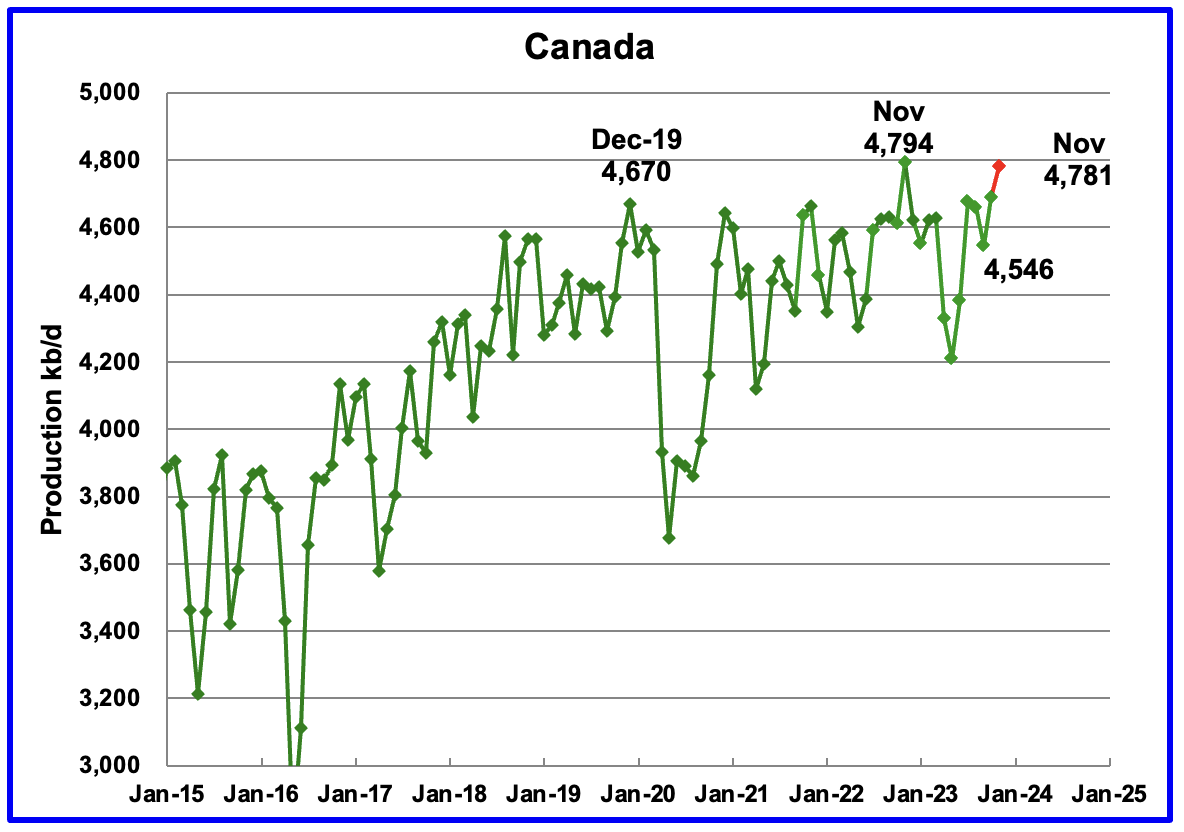
According to the EIA, Canada’s production increased by 123 kb/d in October to 4,669 kb/d.
The STEO is forecasting that Canadian production will rise by 93 kb/d in November to 4,781 and could be at a new high in December, red marker.
In January 2024, the Canada Energy Regulator approved another variance request by the Trans Mountain Pipeline (TMX). Line fill of the TMX pipeline could start in March/April.
A later Report indicated a later start date and additional problems.
“Calgary, 29 January (Argus) — Canada’s 590,000 b/d Trans Mountain Expansion (TMX) will now be completed in the second quarter at the earliest, as complications while pulling pipe through a tunnel this past week created additional delays, the company said today.
Technical issues encountered during pipeline pullback activity between 25-27 January in British Columbia “will result in additional time to determine the safest and most prudent actions for minimizing further delay,” Trans Mountain said in a statement.”
That second paragraph indicates TMX started to pull the pipe through the tunnel and it then got stuck and hence had to pull it back out. They now need time to figure out the problem and the fix. For TMX, it has been one problem after another.
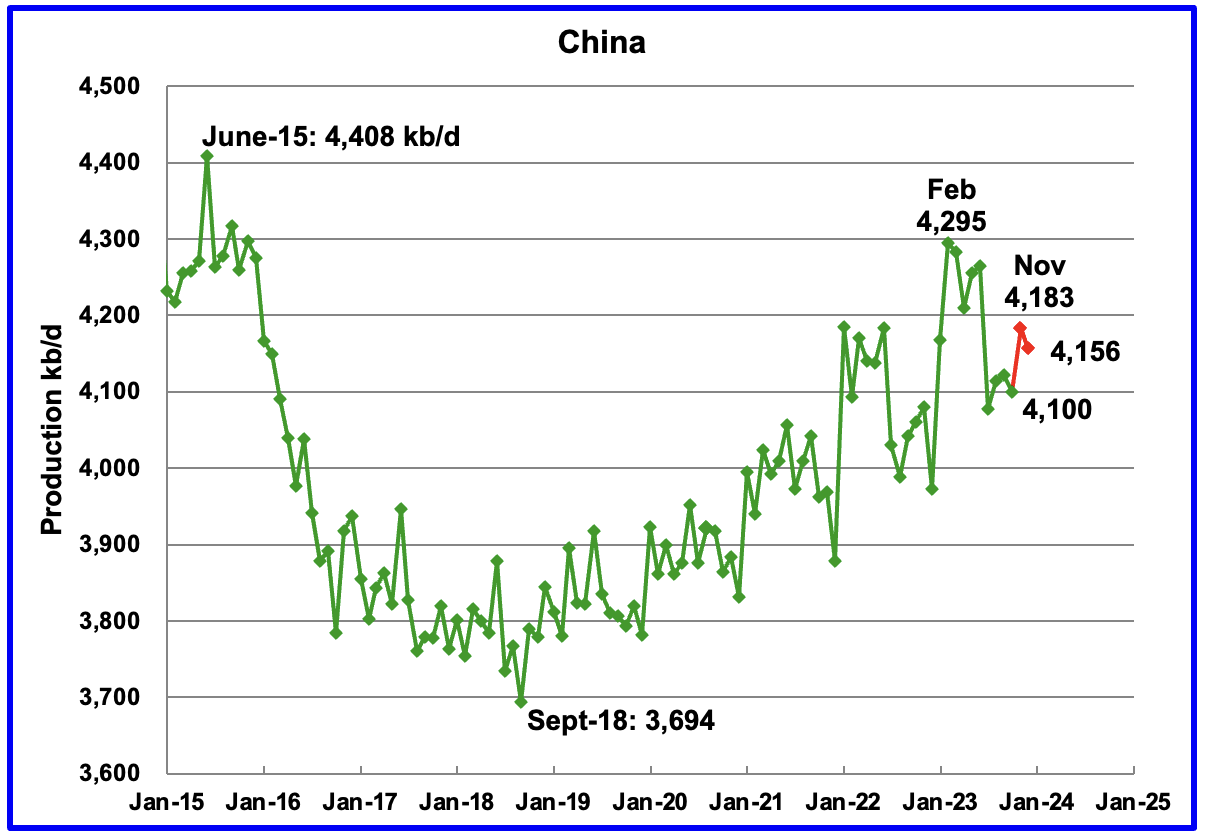
The EIA reported China’s oil output in October dropped by 22 kb/d to 4,100 kb/d.
The China National Bureau of Statistics reported that output rebounded in November by 83 kb/d to 4,183 kb/d and then dropped in December to 4,156 kb/d.
Every January for the last four years, China’s production has seen a massive increase. In 2022 production jumped by 322 kb/d from December 2021 to February 2022. However according to the January MOMR: For 2024, Chinese liquids production is expected to remain steady at the 2023 level of 4.6 m/d. The EIA generally agrees in that it is also projecting no growth for 2024.
While China’s production growth has risen steadily since 2018, it may be approaching its post pandemic high as inferred by the January MOMR and the EIA.
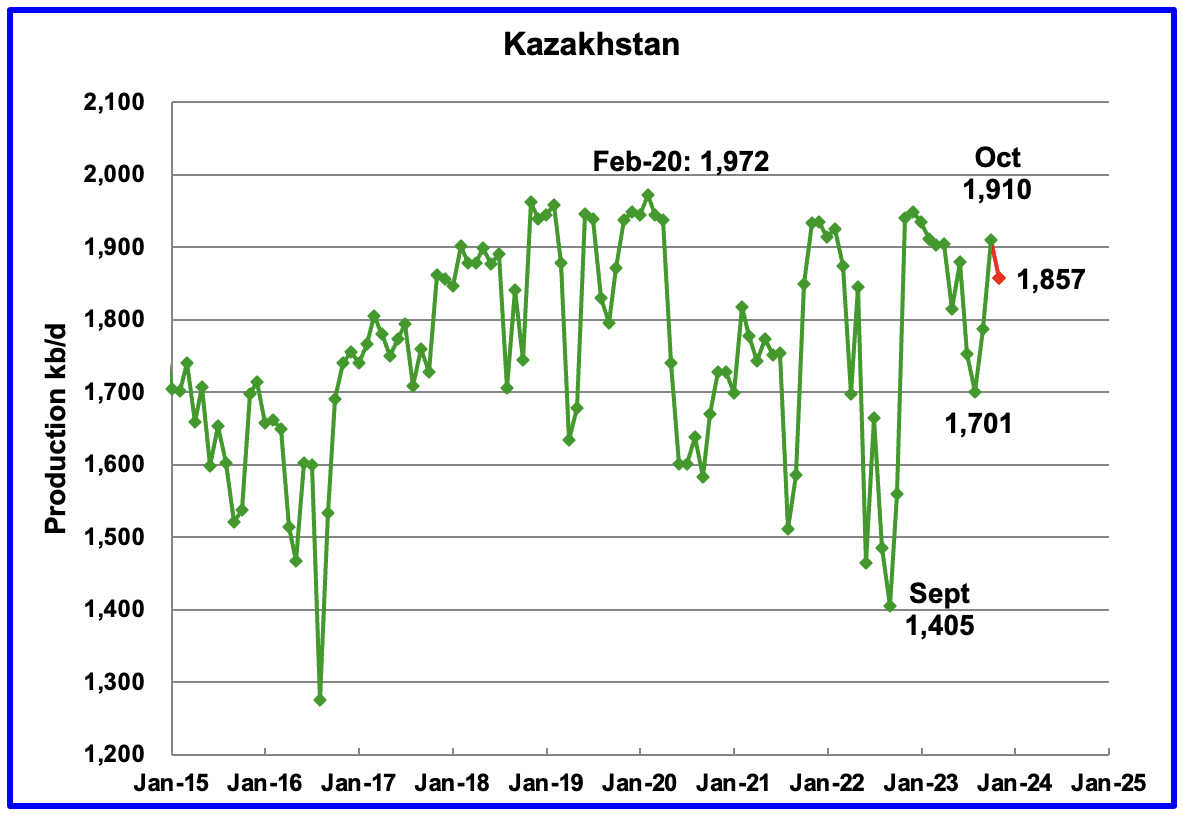
According to the EIA, Kazakhstan’s output increased by 123 kb/d in October to 1,910 kb/d but then dropped in November according to the STEO.
The January MOMR is reporting that “November Crude production dropped by 44 tb/d, m-o-m, to average 1.6 mb/d.”
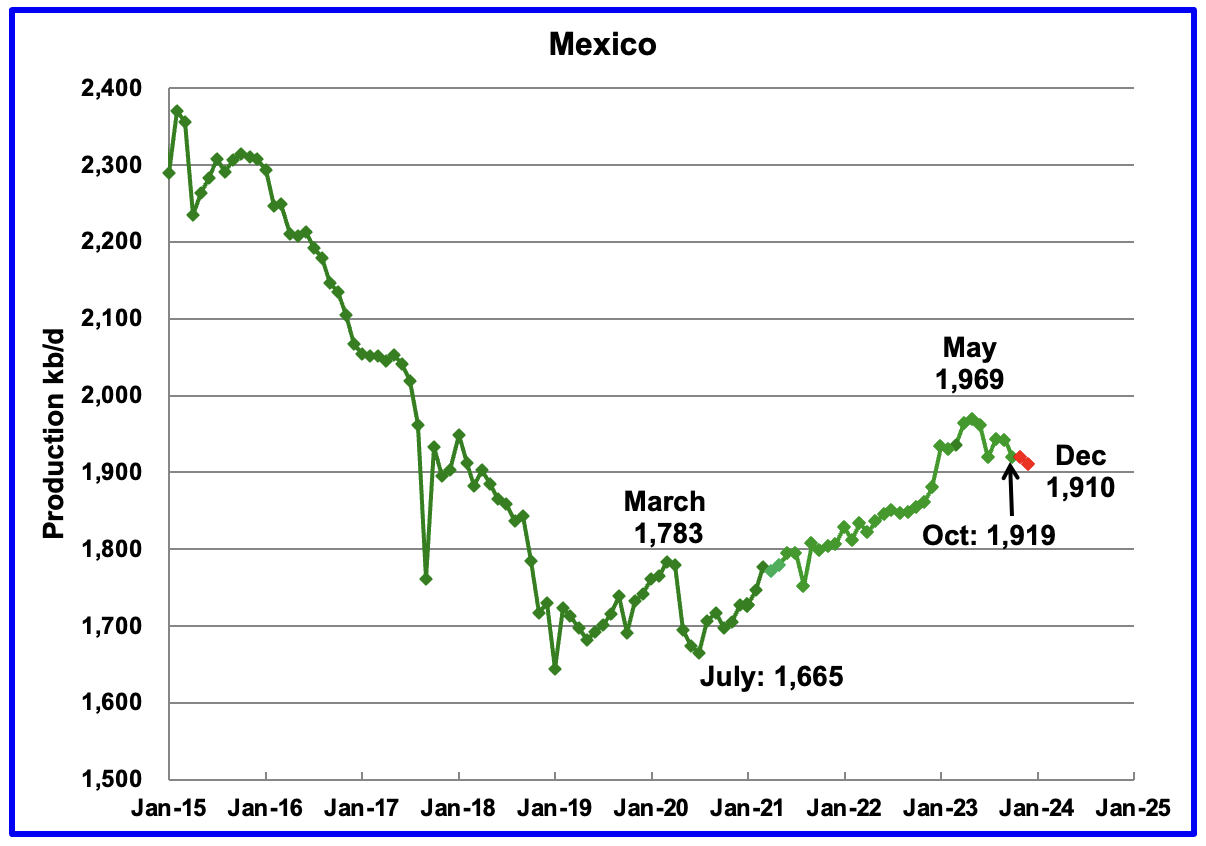
According to the EIA, Mexico’s output decreased by 23 kb/d in October to 1,919 kb/d.
According to Pemex, Mexico’s oil production dropped in December to 1,910 kb/d.
Mexico has recently revised its definition of condensate. This has resulted in the EIA adding an extra 55 kb/d to 60 kb/d, on average, to the Pemex report. The red markers include an additional 60 kb/d.
According to the January 2024 MOMR: “Pemex’s total crude production decline in mature areas like Ku-Maloob-Zaap and Integral Yaxche-Xanab is forecast to outweigh production ramp-ups in Area-1 and El Golpe-Puerto Ceiba, and from a few start-ups, namely TM-01, Paki and AE-0150-Uchukil.“
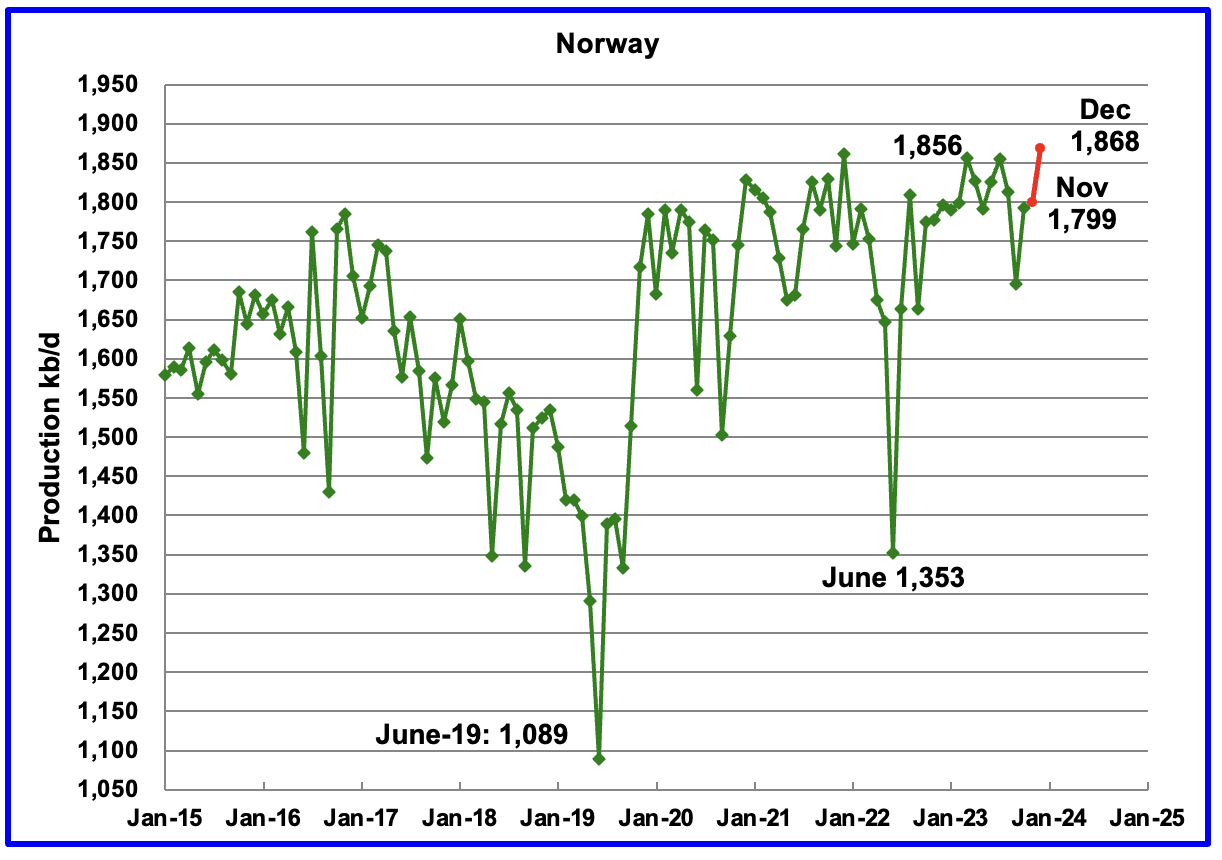
The EIA reported Norway’s October production increased to 1,793 kb/d.
Separately, the Norway Petroleum Directorate (NPD) reported that November’s production added 6 kb/d in November to 1,799 kb/d, red markers, and December made a new post pandemic high of 1,868 kb/d.
According to the NPD : “Oil production in December was 1.9 percent higher than the Norwegian Offshore Directorate’s forecast and 0.5 percent lower than the forecast this year.”
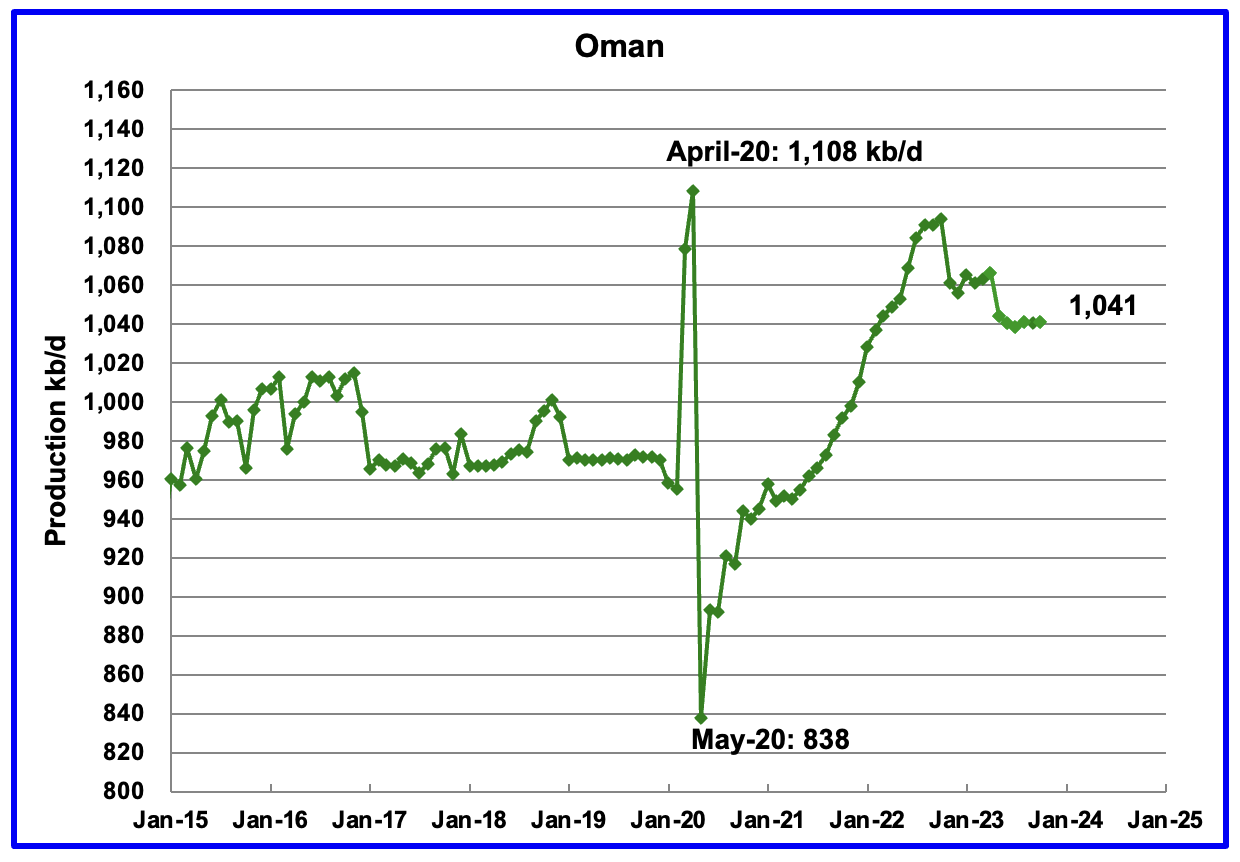
Oman’s production has risen very consistently since the low of May 2020. However production began to drop in November 2022. According to the EIA, October’s output was unchanged at 1,041 kb/d.
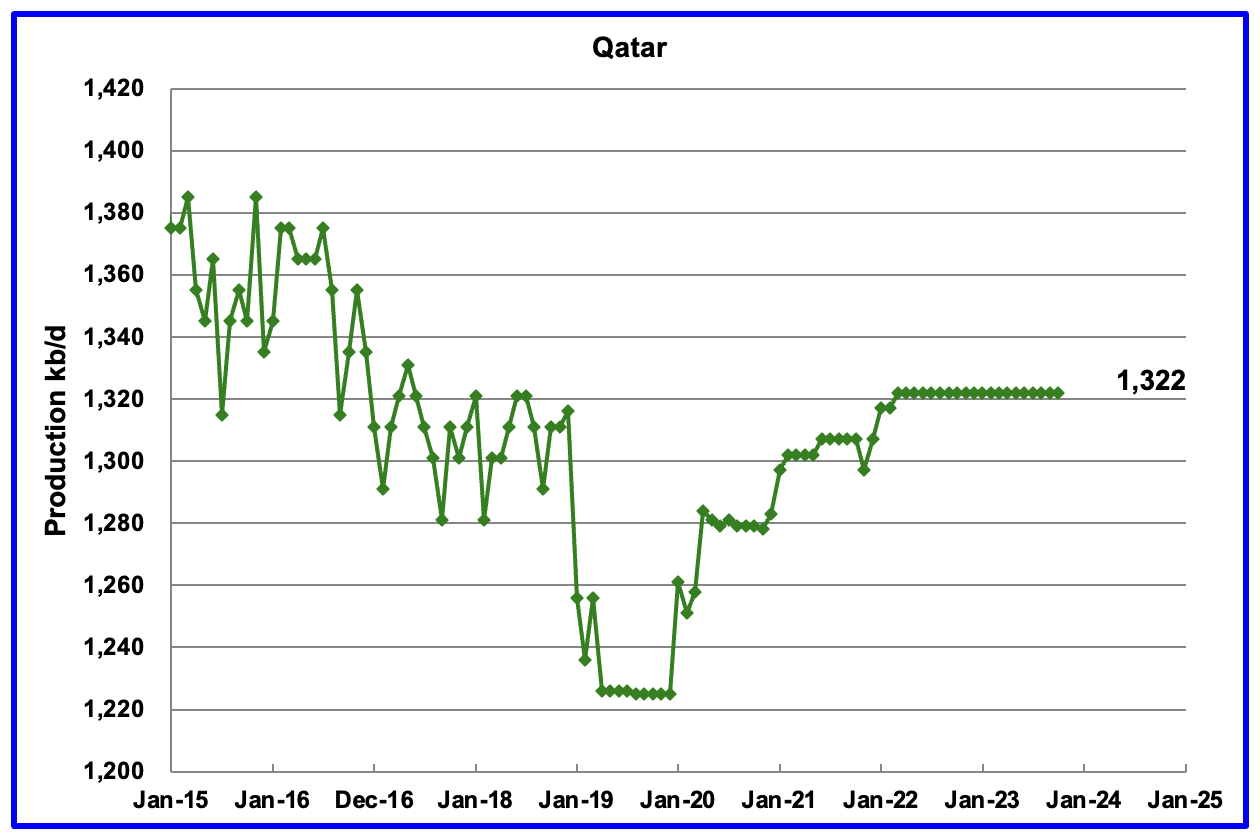
Qatar’s October’s output was unchanged at 1,322 kb/d, possibly due to lack of updated information.
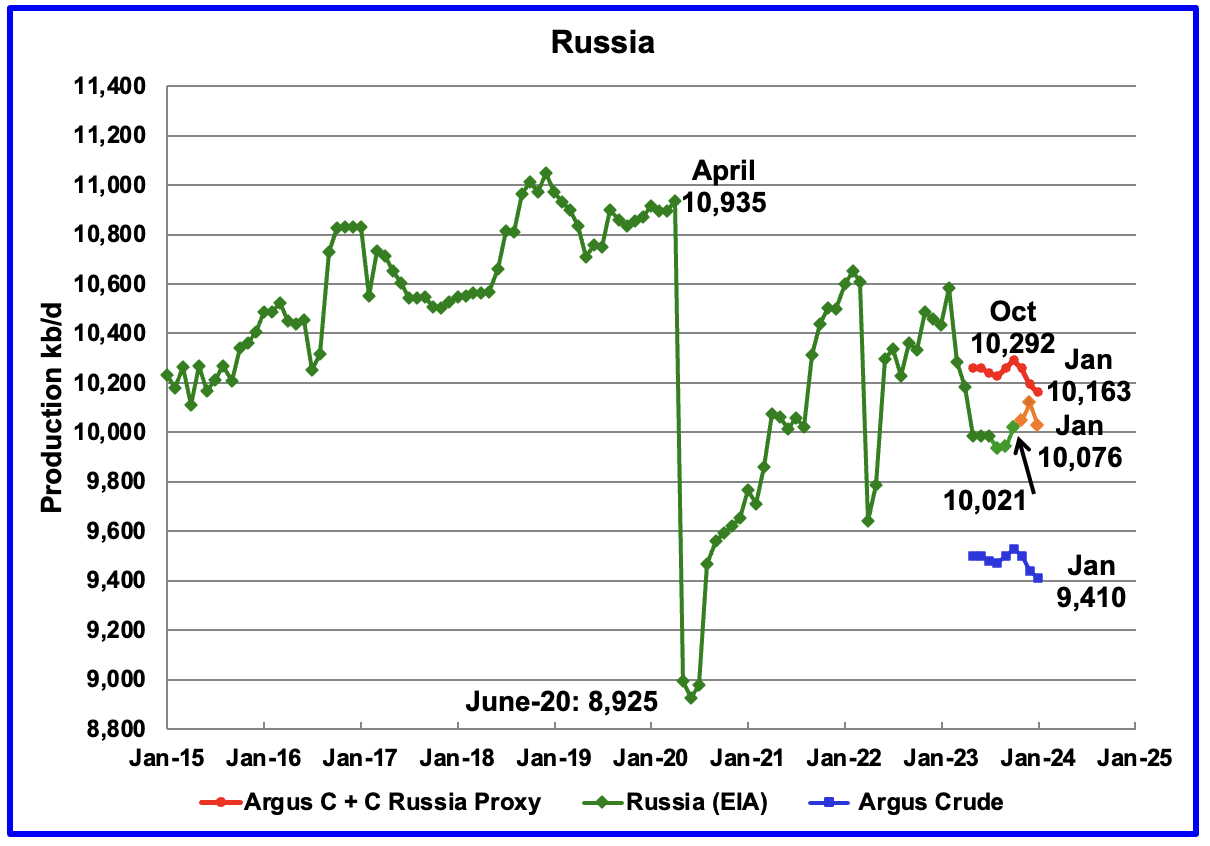
The EIA reported Russia’s October C + C production rose by 80 kb/d to 10,021 kb/d. Using data from the February STEO report, Russian output is expected be slightly higher at 10,076 kb/d in January 2024, orange markers.
Using data from Argus Media reports, Russian crude production is shown from May 2023 to January 2024. For January 2024, Argus reported that Russian crude production was 9,410 kb/d, a decrease of 30 kb/d, blue markers. Adding 8% to Argus’ January crude production provides a C + C production estimate of 10,163 kb/d, which is a proxy for the Pre-War Russian Ministry estimate, red markers. S & P Platts reports that Russian January crude production was 9,420 kb/d, down 10 kb/d from December, very close to the Argus estimate.
Comparing the Argus crude data with the latest STEO projection indicates that the EIA’s estimate for Russian C + C is between the two Argus estimates for Crude and C + C. Prior to the war, the Russian Ministry estimate was alway 404 kb/d higher than the EIA estimate for C + C. The current October Russia Proxy output is 216 kb/d higher than the EIA’s Russia estimate.
If the EIA’s STEO Russian production projection is correct, this indicates that there is no sign that Western sanctions are affecting their oil production at this time. However the trend in the Argus data indicates that Russian production has been slowly declining since October 2023. Note the trend difference between the EIA and Argus production estimates after October. Is this an indication EIA’s estimate for Russian C + C is too high or Argus is too low?
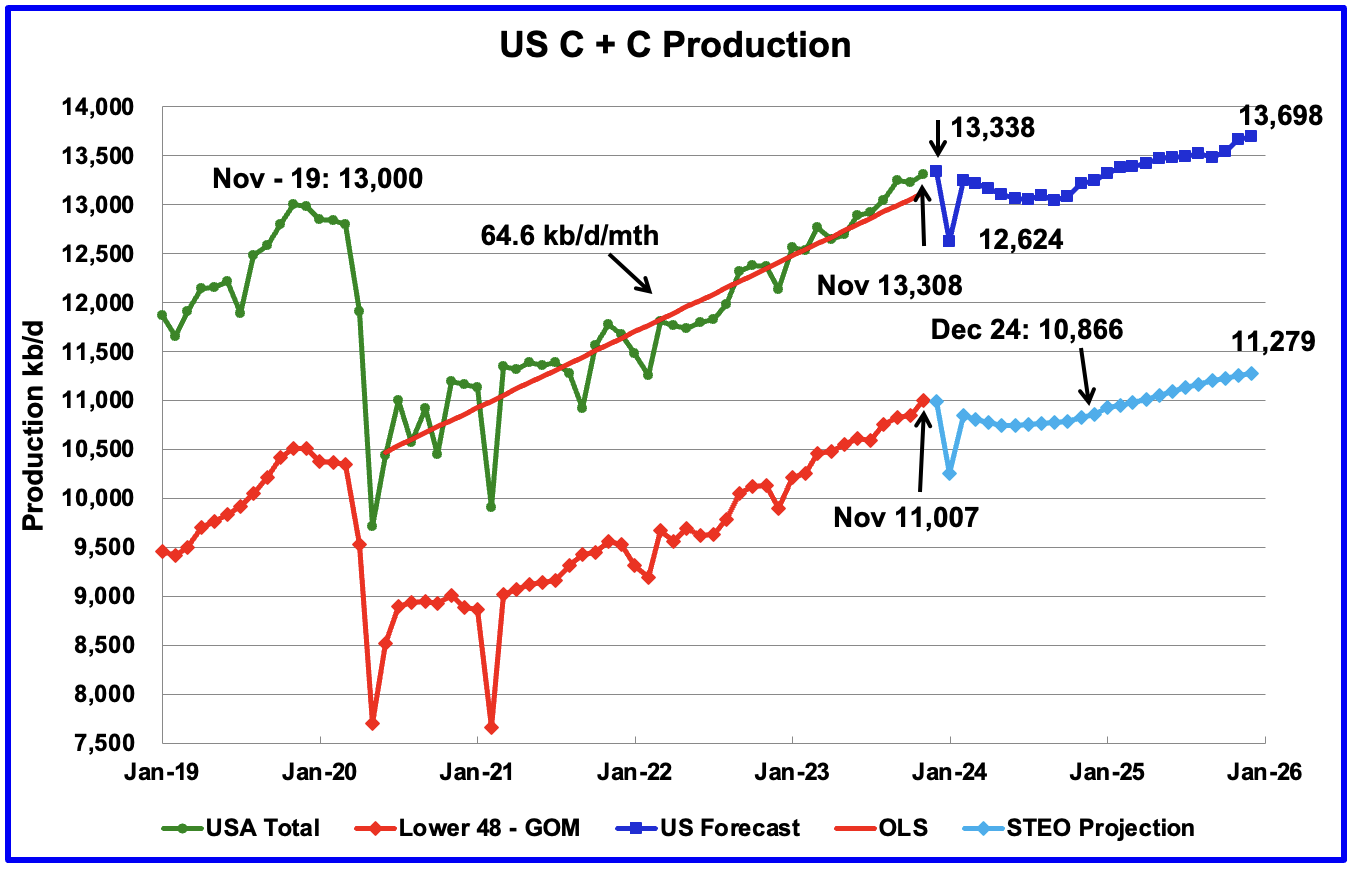
U.S. November oil production increased by 84 kb/d to 13,308 kb/d, a new record high. The increase was primarily due to increases in Texas and New Mexico offset by a decrease in the GOM.
The US projections in this chart has been updated using the February STEO.
The dark blue graph is the forecast for U.S. oil production from December 2023 to December 2025. Output for December 2025 is expected to reach 13,698 kb/d, close to 100 kb/d higher than forecast in last week’s US post.
The light blue graph is the STEO’s projection for output to December 2025 for the Onshore L48. For 2024, the STEO is forecasting dropping production in the L48 states. From December 2023 to December 2024, production is expected to drop by 127 kb/d.
Rig Report for Week Ending February 9
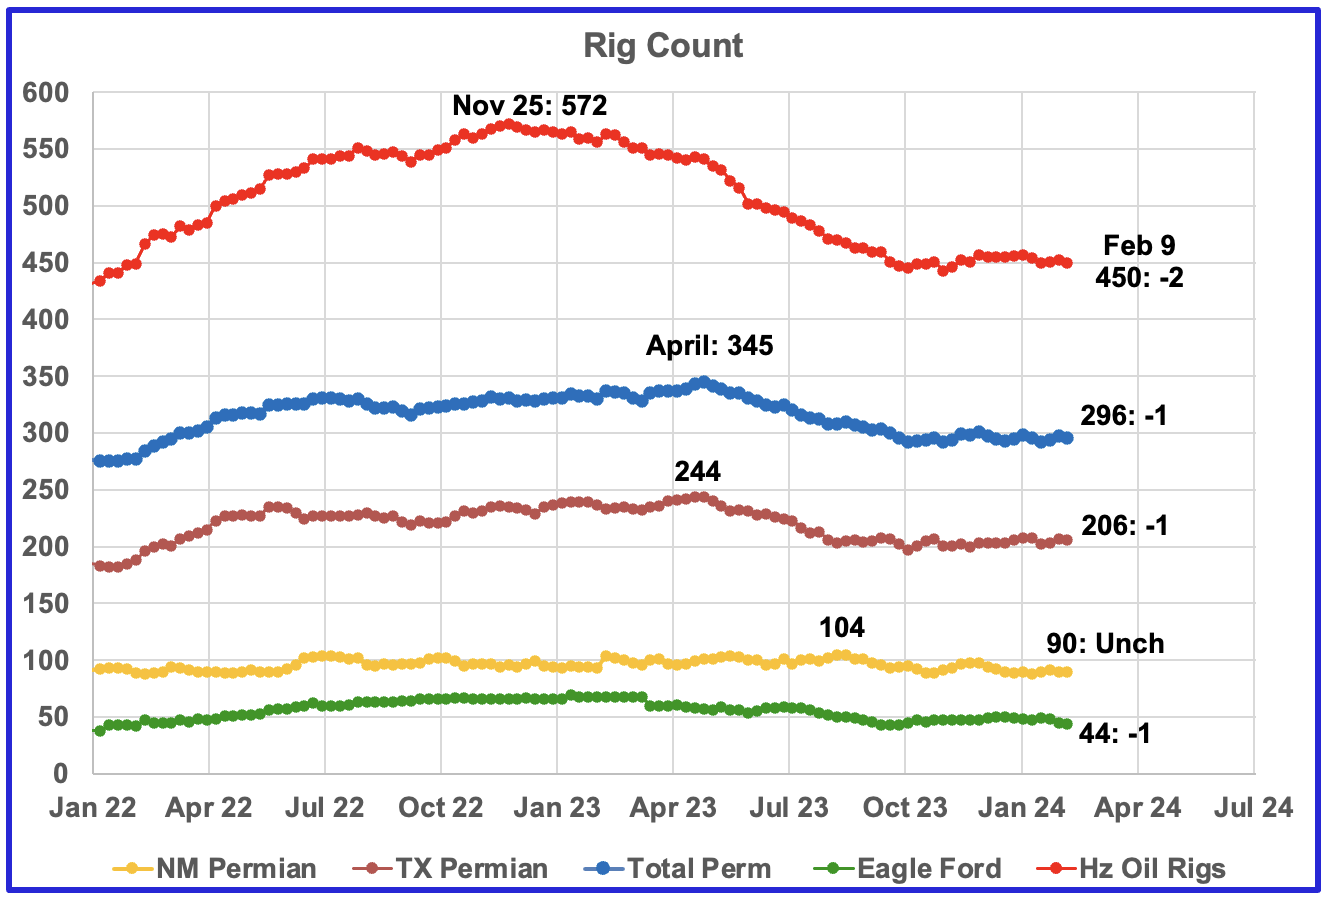
– US Hz oil rigs decreased by 2 to 450. The rig count has been close to 450 since the beginning of October.
– Permian rigs were down 1 to 296. Texas Permian was down 1 at 206 while NM was unchanged at 90. In New Mexico, Lea county added 3 to 43 while Eddy dropped 3 to 47.
– Eagle Ford dropped 1 to 44 and is 1 rig above the low of September 2023.
– NG Hz rigs added 4 to 109 (not shown)
Frac Spread Count for Week Ending February 9
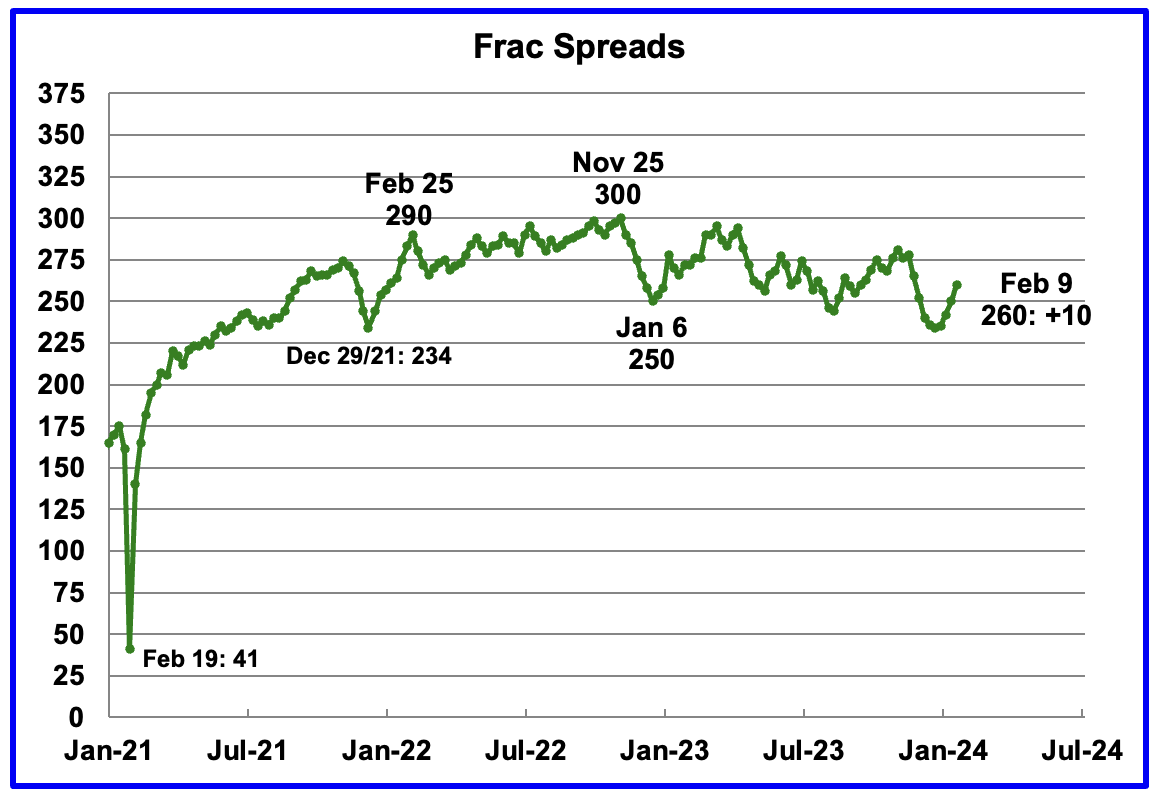
The frac spread count was up 10 to 260 and is down 6 from one year ago.
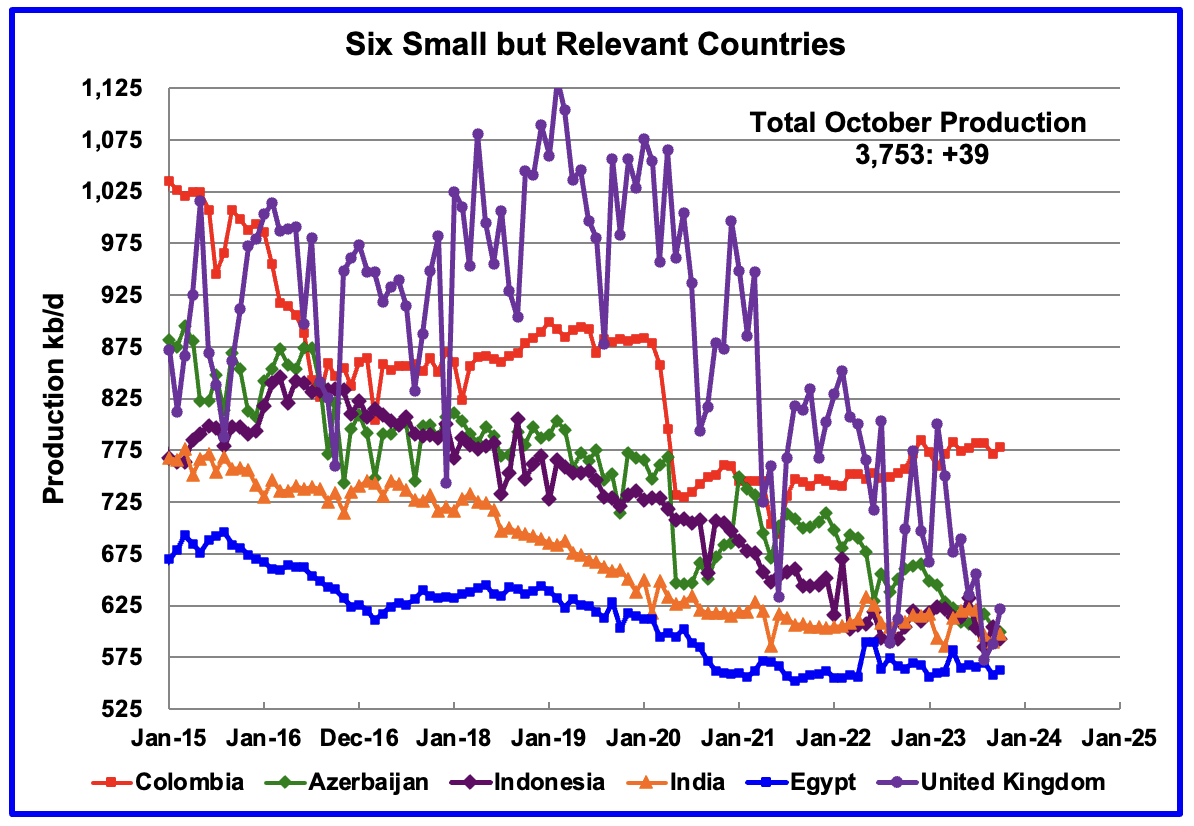
These six countries complete the list of Non-OPEC countries with annual production between 500 kb/d and 1,000 kb/d. Note that the UK has been added to this list since its production has been below 1,000 kb/d since 2020 and fell to a new low of 573 kb/d in August. in October, the UK added 33 kb/d to 621 kb/d.
Their combined October production was 3,753 kb/d, up 39 kb/d from September. The main contributor to the increase was the UK.
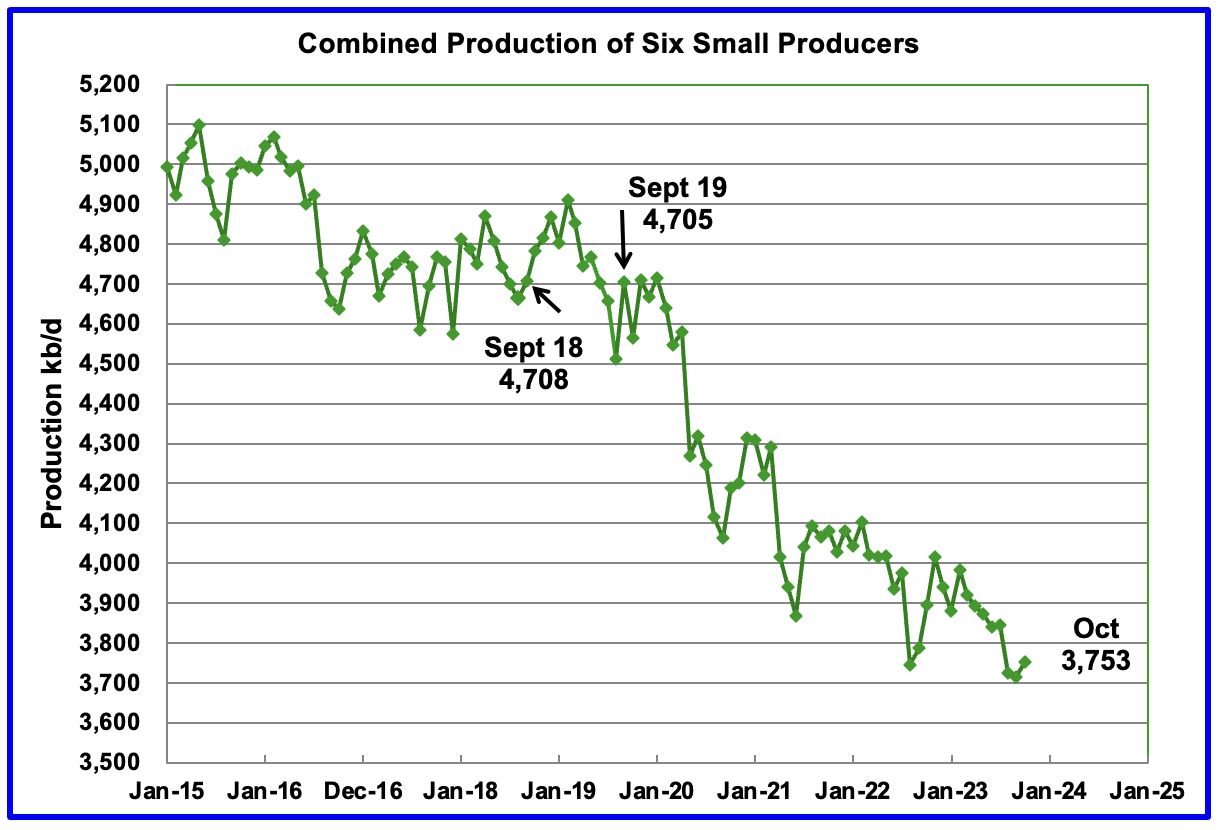
The overall output from the above six countries has been in a slow steady decline since 2014 and appears to have accelerated after 2019.
The decline from either September 2018 or September 2019 to October 2023 is essentially 1,000 kb/d. This means that the combined average decline rate for these six countries is somewhere between 200 kb/d/yr and 250 kb/d/yr.