By Ovi
All of the Crude plus Condensate (C + C) production data for the US state charts comes from the EIAʼs Petroleum Supply monthly PSM which provides updated information up to November 2023.
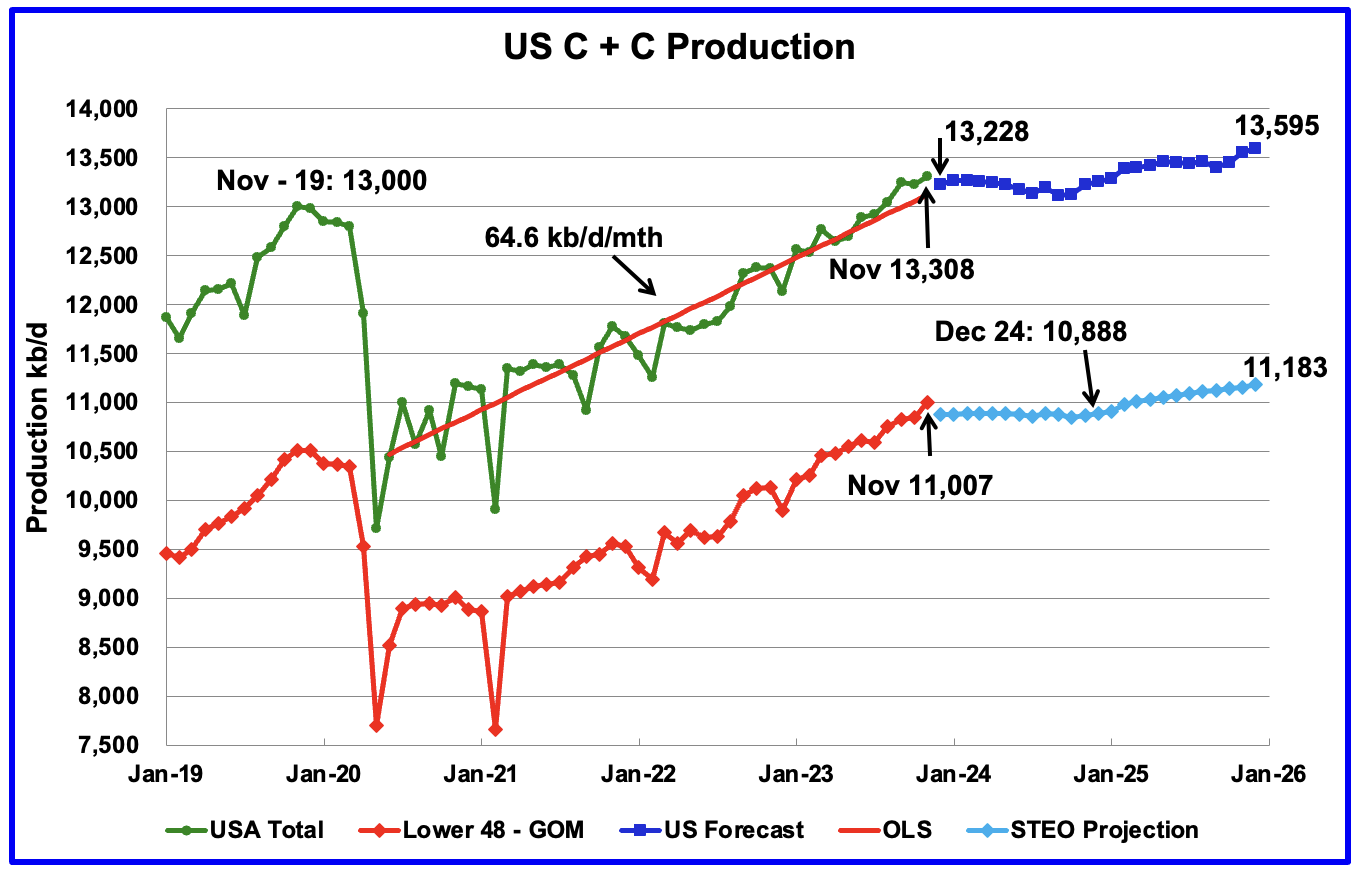
U.S. November oil production increased by 84 kb/d to 13,308 kb/d, a new record high. The increase was primarily due to increases in Texas and New Mexico offset by a decrease in the GOM. Note that October production was revised down from 13,248 kb/d to 13,224 kb/d.
The dark blue graph, taken from the January 2023 STEO, is the forecast for U.S. oil production from December 2023 to December 2025. Output for December 2025 is expected to reach 13,595 kb/d.
The red OLS line from June 2020 to October 2023 indicates a monthly production growth rate of 64.6 kb/d/mth or 775 kb/d/yr. Clearly the growth rate going forward into 2024, shown by the dark blue graph, is flat and significantly lower than seen in the previous June 2020 to November 2023 time period. From November 2023 to December 2024, production is expected to drop by 119 kb/d.
While overall US oil production increased by 84 kb/d, the Onshore L48 had a production increase of 160 kb/d to 11,007 kb/d in November.
The light blue graph is the STEO’s projection for output to December 2025 for the Onshore L48. From November 2023 to December 2025, production is expected to increase by 176 kb/d to 11,183 kb/d. Production for most of 2024 in the Onshore L48 will be essentially flat.
Oil Production Ranked by State

Listed above are the 10 US states with the largest oil production along with the Gulf of Mexico. These 10 states accounted for 82.8% of all U.S. oil production out of a total production of 13,308 kb/d in November 2023.
On a YoY basis, US production increased by 929 kb/d with the majority, 807 kb/d coming from Texas, New Mexico and North Dakota. GOM production dropped by 78 kb/d MoM while YOY it is up 79 kb/d.
Note that on a YOY basis, three of the smaller producing states have increased production, Colorado, Wyoming and Utah.
State Oil Production Charts

Texas production increased by 76 kb/d in November to 5,662 kb/d. However, relative to October’s production reported last month, 5,607 kb/d, November output was up by 55 kb/d.
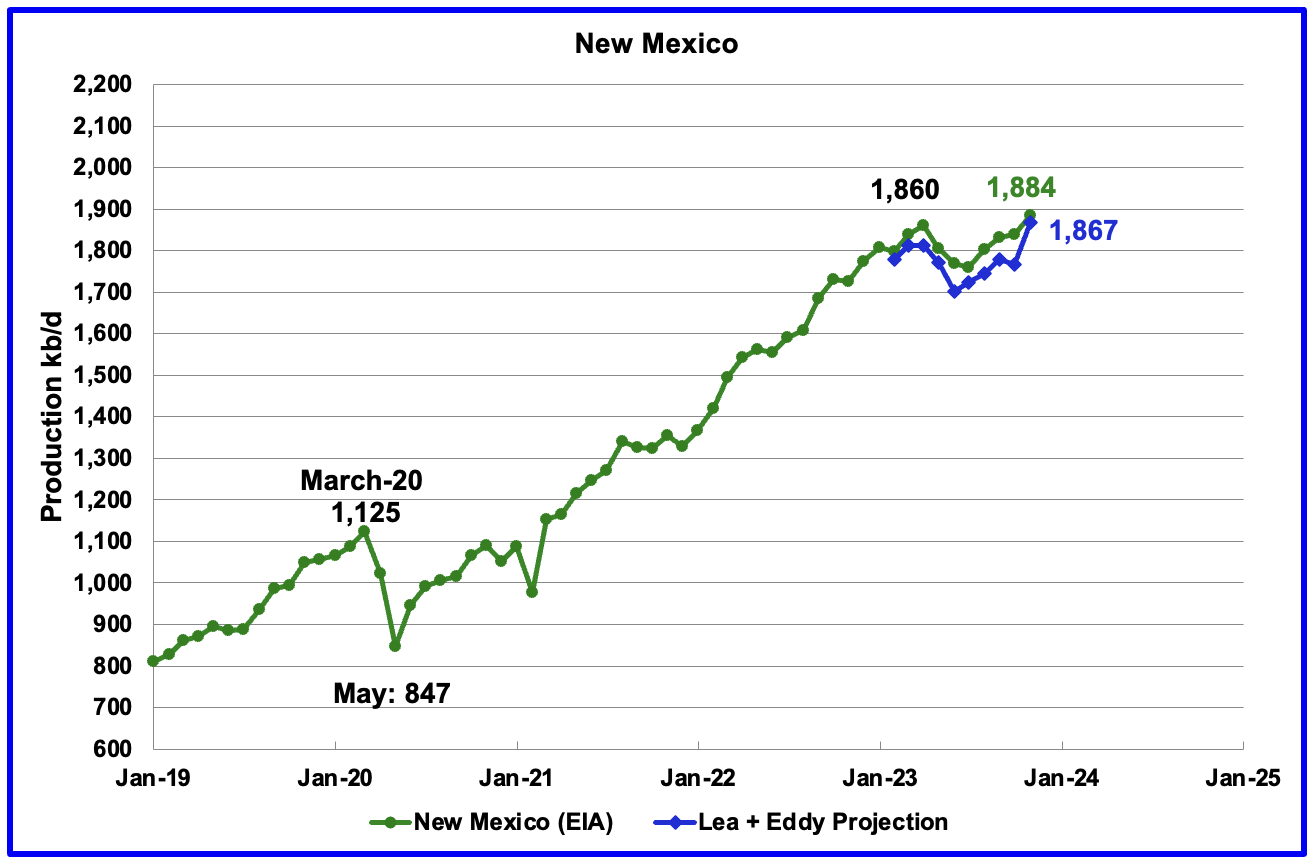
New Mexico’s November production rose by 45 kb/d to 1,884 kb/d.
The blue graph is a production projection for Lea plus Eddy counties. The projection used the difference between November and October production data provided by the New Mexico Oil Conservation Division.
The combined output from Lea and Eddy counties in November increased by 101 kb/d. It is interesting to note that the Lea + Eddy production trend is similar to the EIA’s except for October.
More production information from these two counties is reviewed in the special Permian section further down.
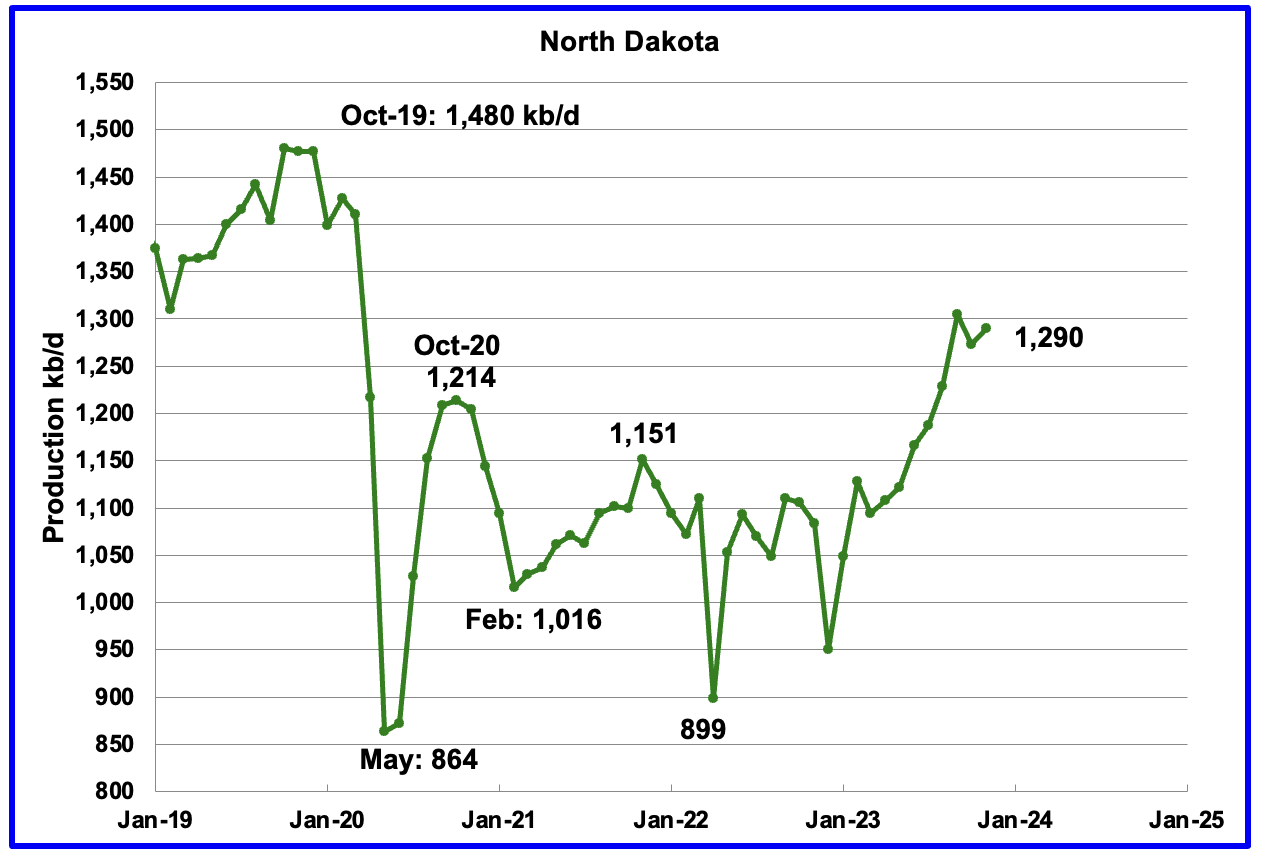
November’s output increased by 17 kb/d to 1,290 kb/d.
According to this source, production growth for October was lower due to October bad weather. The bad weather extended into November and may account for the small 17 kb/d November increase.
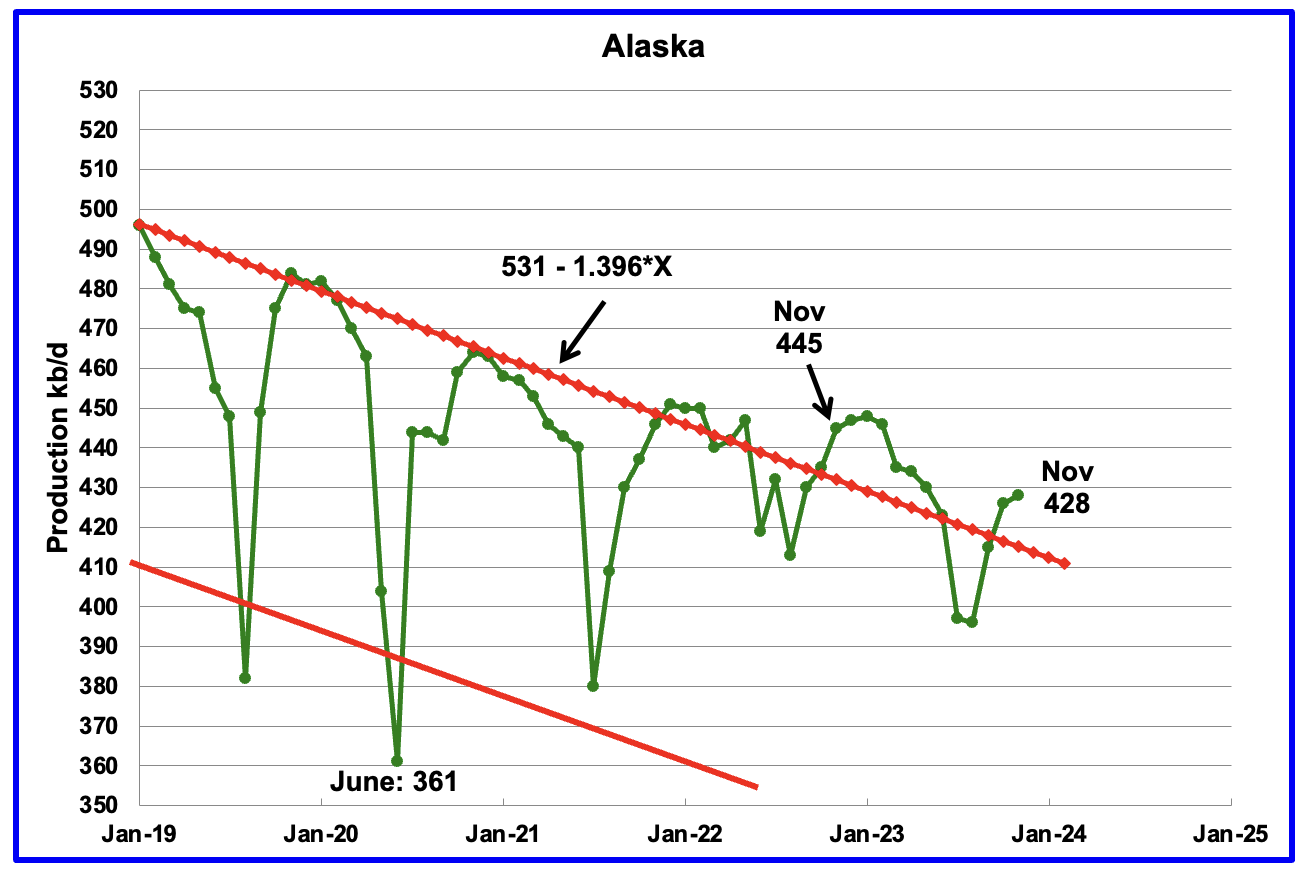
Alaskaʼs November output increased by 2 kb/d to 428 kb/d. Production YoY is down by 17 kb/d. The EIA weekly petroleum report continues to show January Alaska production is in the 425 kb/d to 435 kb/d range.
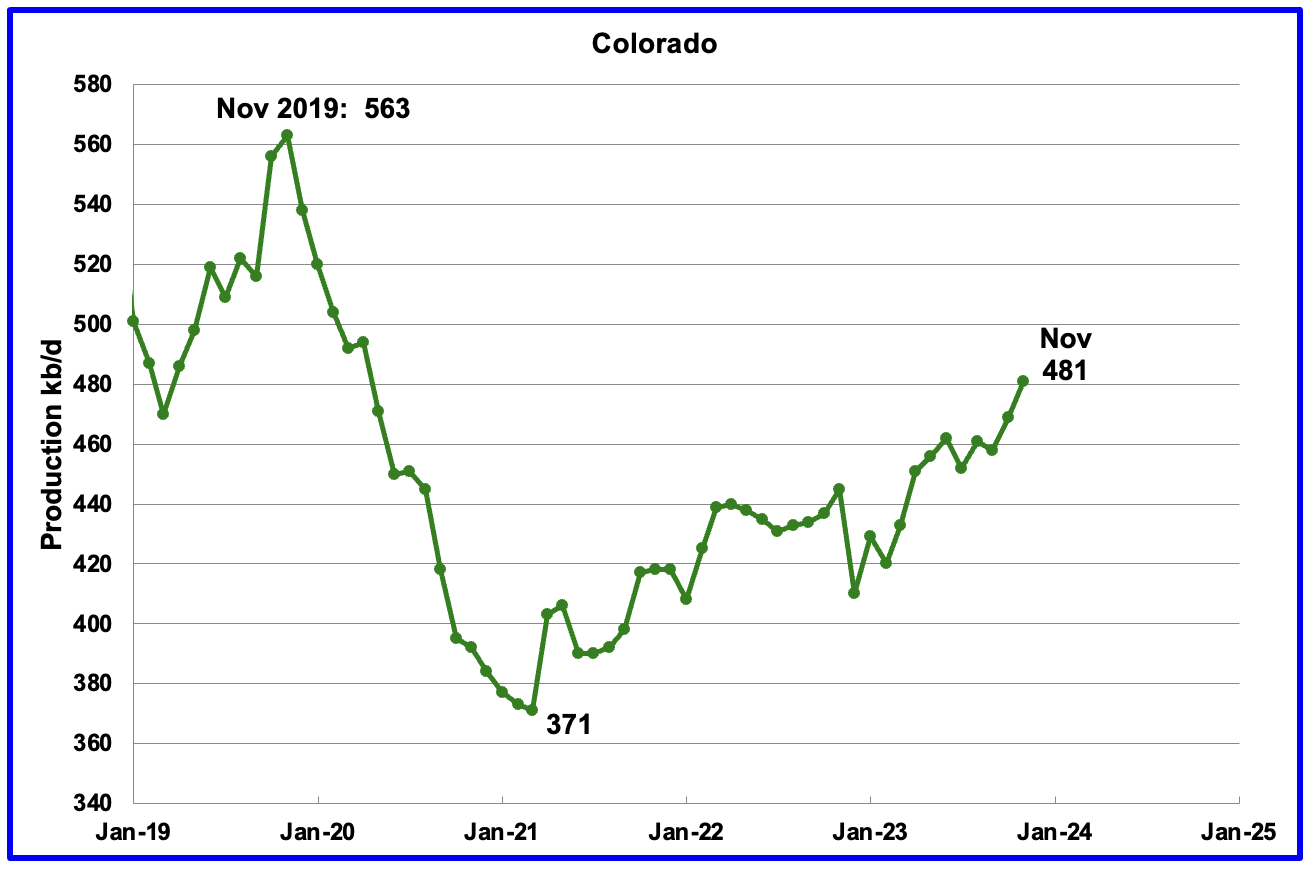
Coloradoʼs November production increased by 12 kb/d to 481 kb/d. Colorado has moved ahead of Alaska to become the 4th largest oil producing state.
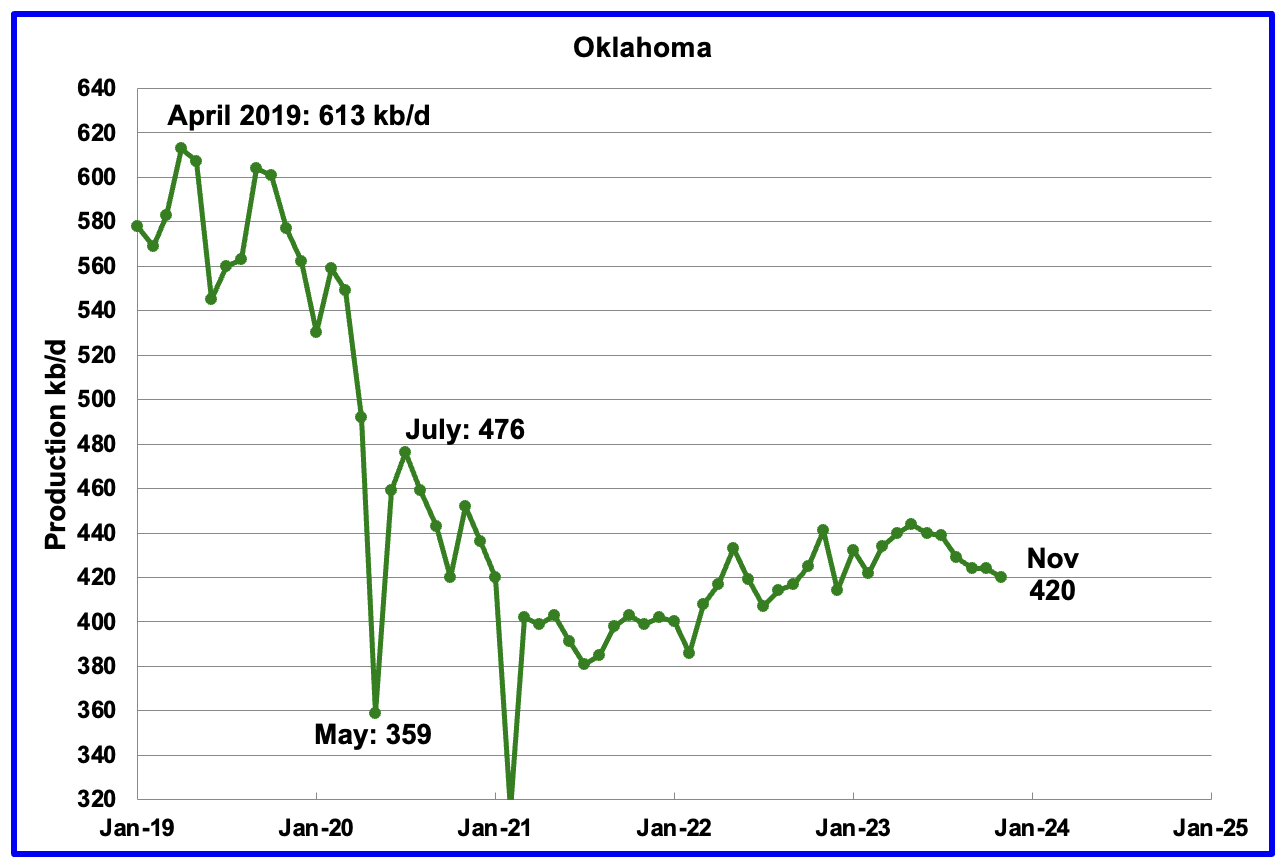
Oklahoma’s output in November decreased by 4 kb/d to 420 kb/d. Production remains 56 kb/d below the post pandemic July 2020 high of 476 kb/d. Output may have entered plateau/declining phase.

Californiaʼs November production declined 1 kb/d to 305 kb/d.
According to this Article, “The two largest U.S. oil producers, Exxon Mobil and Chevron will formally disclose a combined $5 billion write down of California assets when they report fourth-quarter results.”
“Exxon Mobil last year exited onshore production in the state, ending a 25-year-long partnership with Shell PLC when they sold their joint-venture properties.
Chevron will also take charges of about $2.5 billion tied to its California assets. It is staying but bitterly contesting state regulations on its oil producing and refining operations in the state, where it was born 145 years ago as Pacific Coast Oil Co.
California’s energy policies are “making it a difficult place to invest,” even for renewable fuels, a Chevron executive said this month. The company pumps oil from fields developed 100 years ago but has cut spending in the state by “hundreds of millions of dollars since 2022,” the executive said.”
It is not clear if this action by Exxon and Chevron will accelerate/change the production decline rate in California.
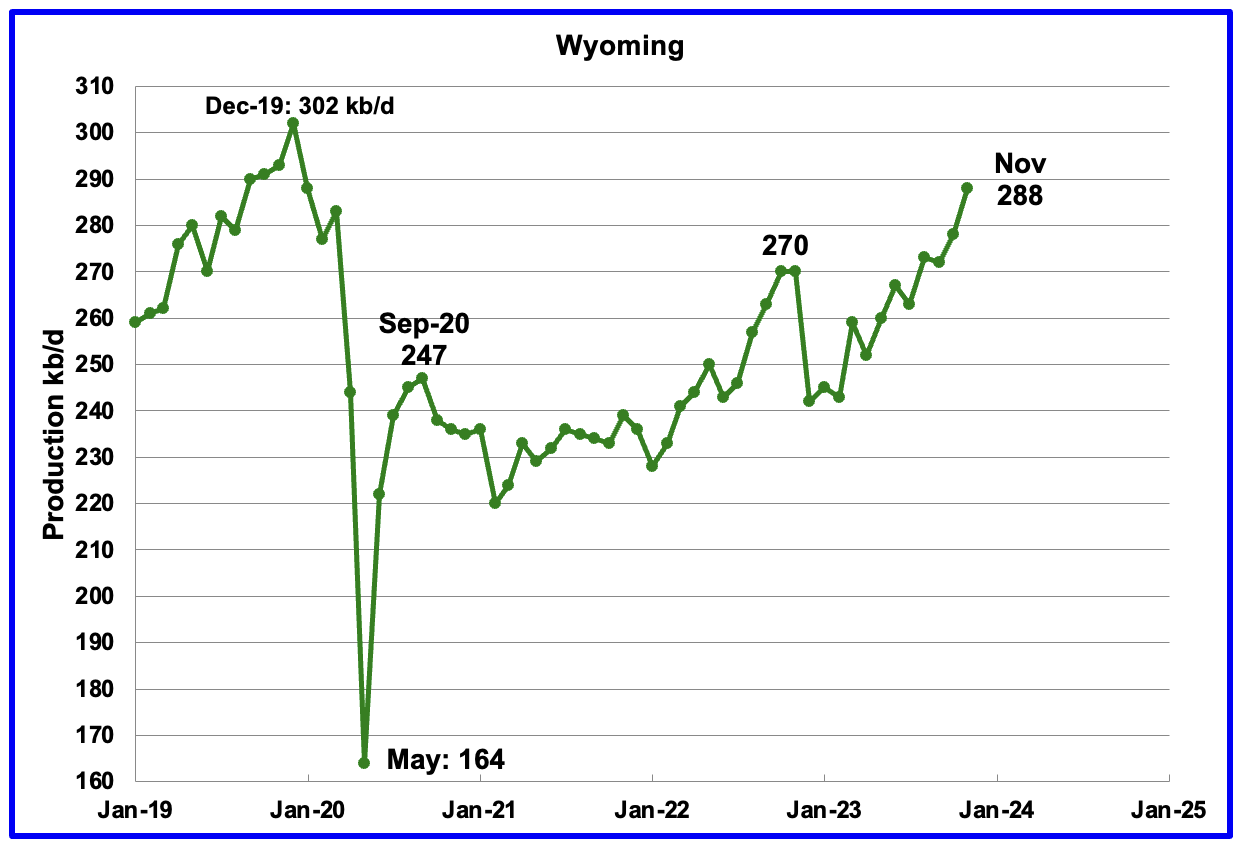
Wyoming’s oil production has been rebounding since March 2023. November’s oil production rose to 288 kb/d, a post pandemic record high.
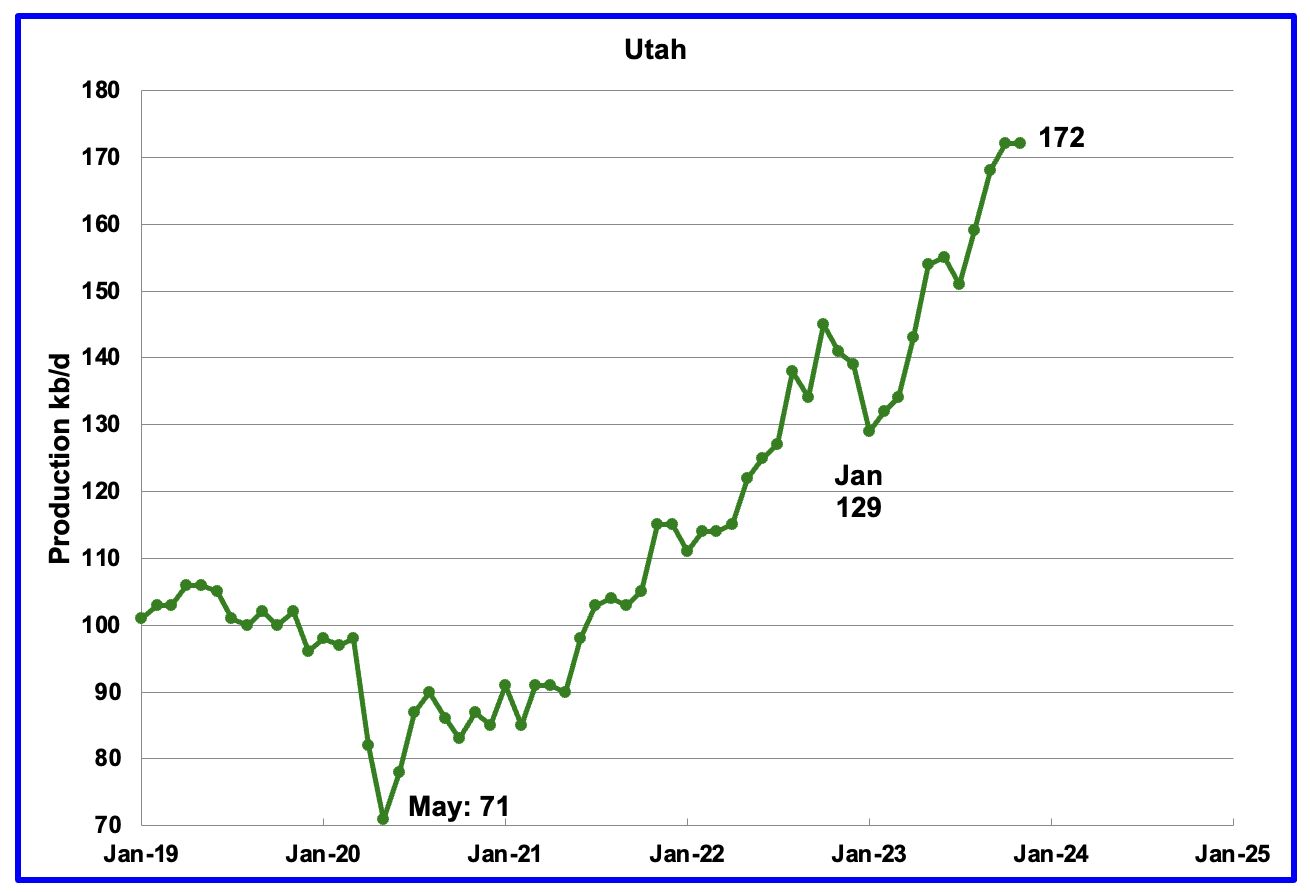
November’s production was unchanged at 172 kb/d. For the first 4 months of 2023, Utah had 7 rigs operating. Since May the number of operational rigs has bounced between 8 and 9, which may account for the increased production.
The increased production since February has come from the Uinta basin.
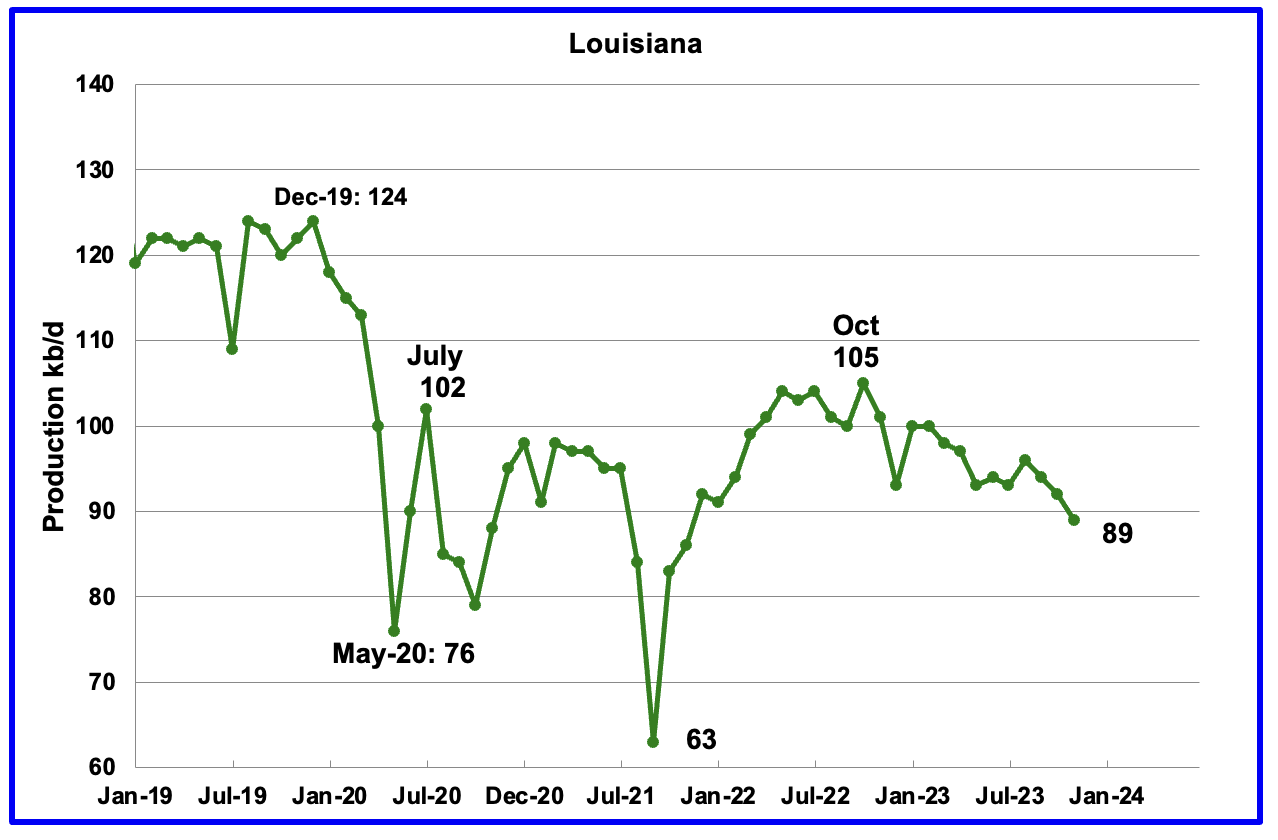
Louisiana’s output entered into a slow decline phase in October 2022. November’s production decreased by 3 kb/d to 89 kb/d and is 16 kb/d lower than the recent October 2022 high.
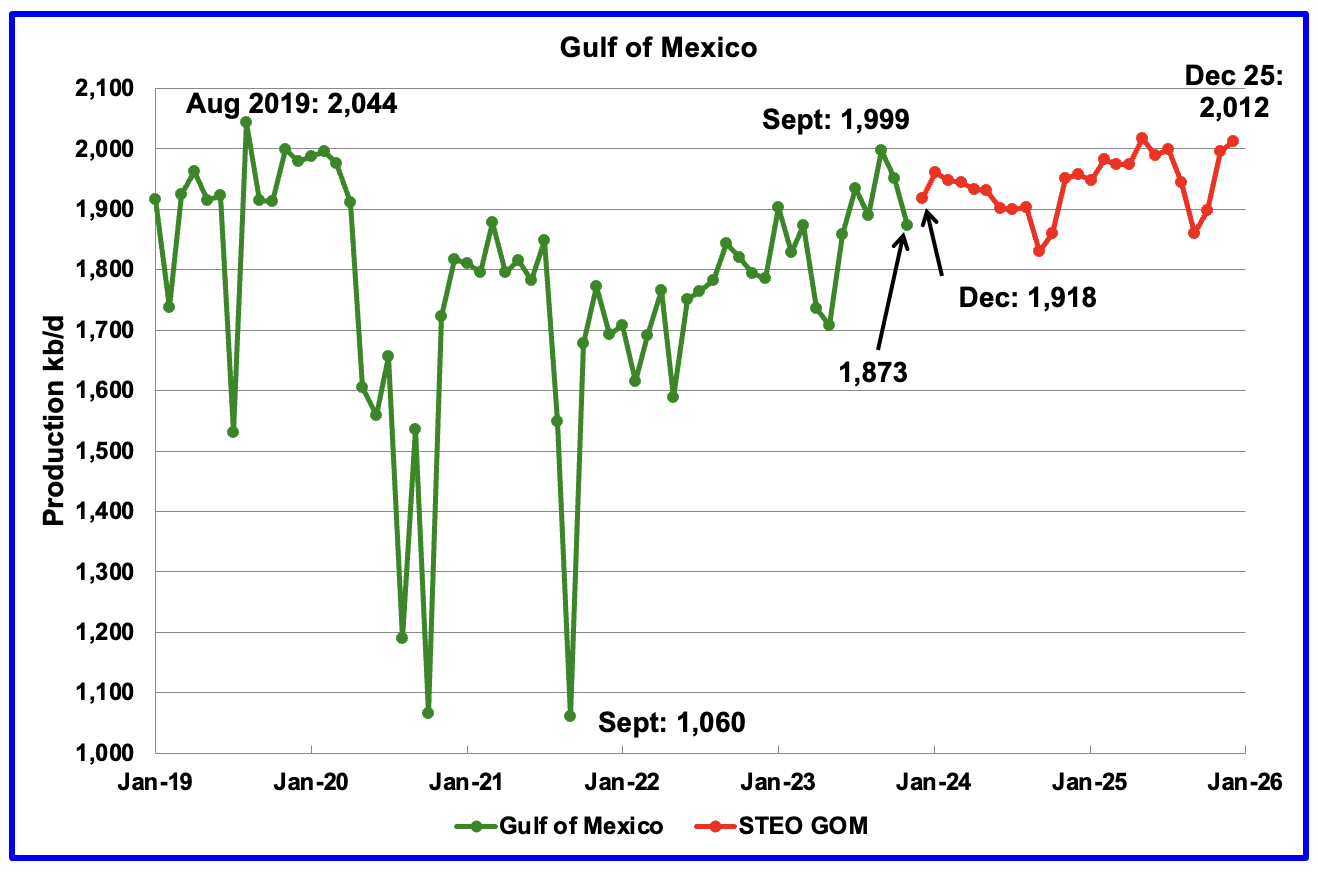
GOM production decreased by 78 kb/d in November to 1,873 kb/d but is expected to rebound in December by 45 kb/d to 1,918 kb/d.
The January 2024 STEO projection for the GOM output has been added to this chart. It projects that over the next 24 months production will increase to 2,012 kb/d in December 2025.
It is not known if the GOM decline shown after January 2024 is related to a combination of extensive maintenance and a general decline of wells. Also disappointing production from some highly touted wells could be an issue according to this source.
George Kaplan has provided the following chart and comment regarding production from GOM startups that began in 2022/23.
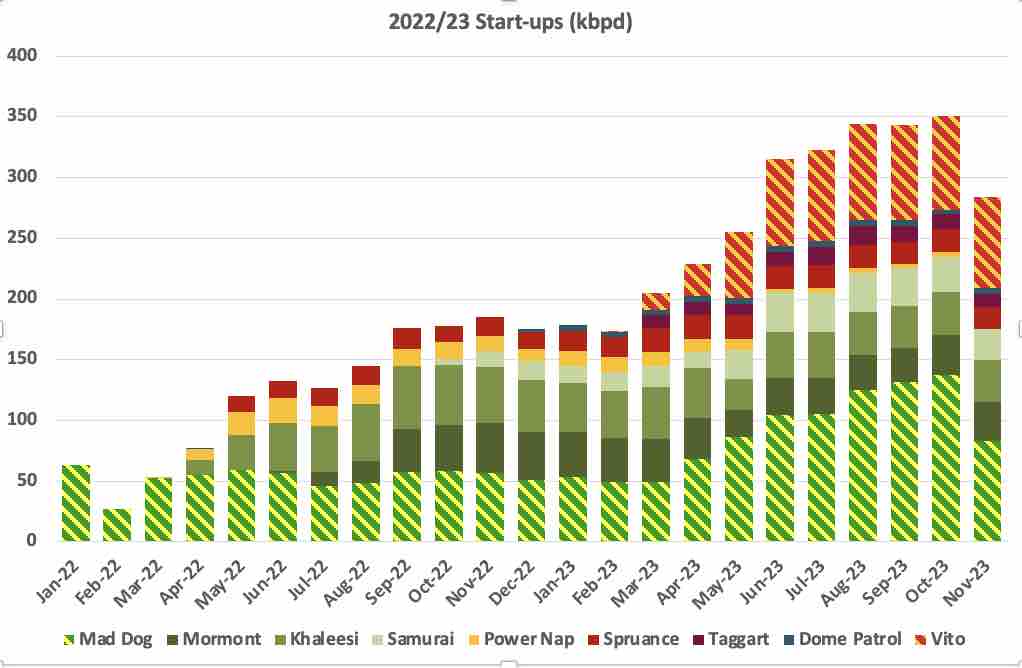
All except the two smallest of the recent leases added for GOM had lower production in November, with Mad Dog having several days of turnaround. I’m not sure if Mad Dog has the potential to increase above its previous maximum and Vito should hold a plateau for a couple of years, but all the others look to be now in decline. Water cut in Taggart is rising very quickly and it is also impacting Spruance and Khaleesi. Of the new leases expected Rydberg is some months late, no news on Whale (also now late wrt original Shell announcement at time of FID) or Shenzi North yet. The Main Pass pipeline seems to be still out, so about 70 kbpd offline.
A Different Perspective on US Oil Production
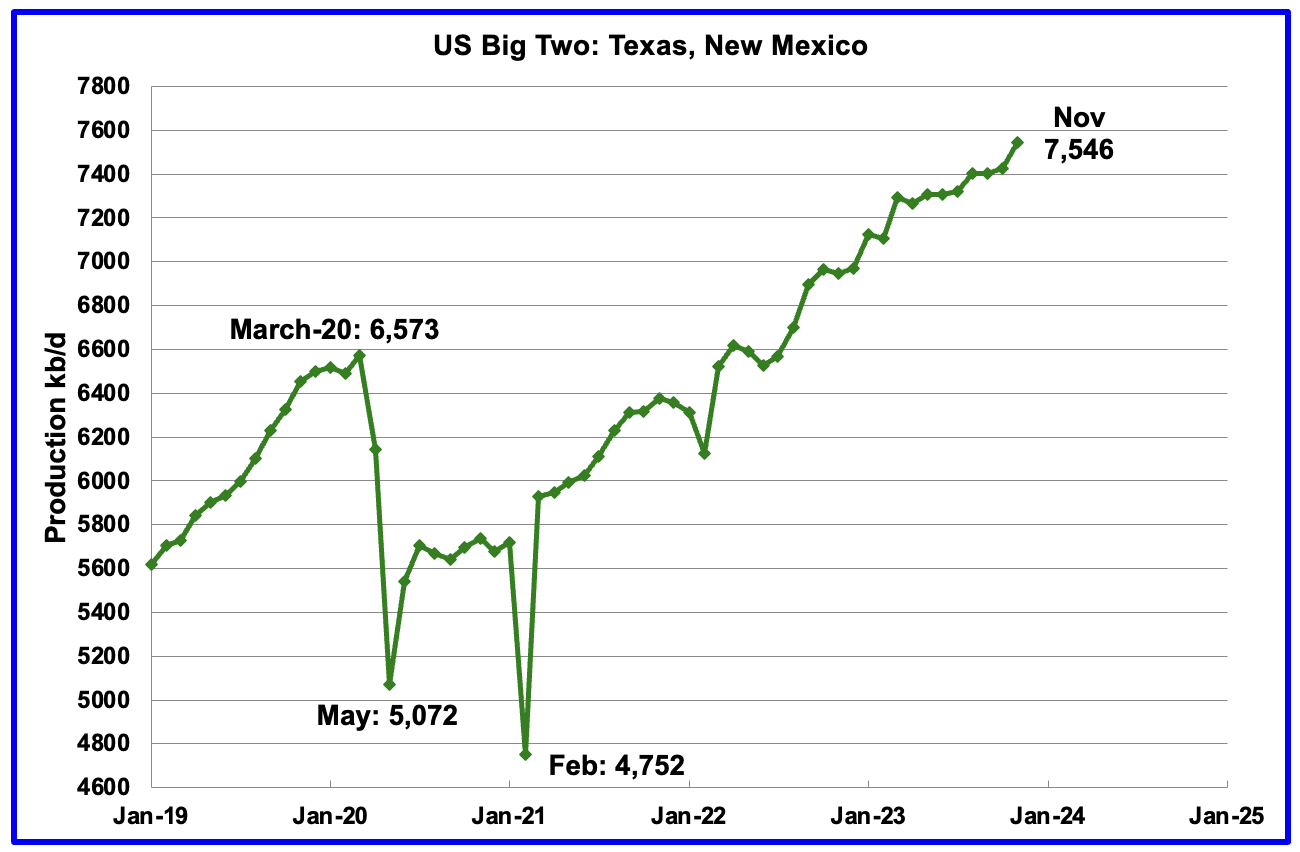
The Big Two states’ combined oil output for Texas and New Mexico.
November’s production in the Big Two states increased by a combined 121 kb/d to 7,546 kb/d with Texas adding 76 kb/d while New Mexico added 45 kb/d.
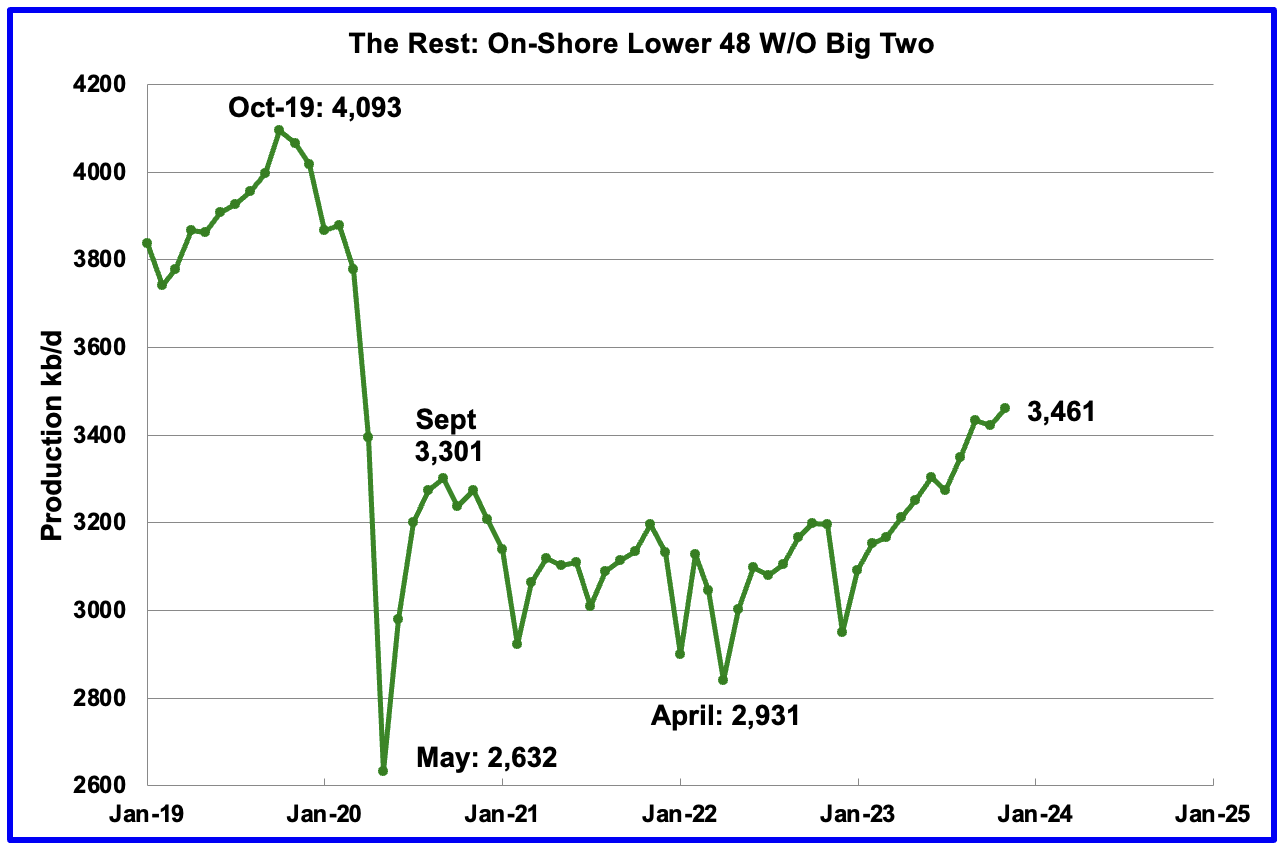
Oil production by The Rest
November’s production in The Rest increased by 39 kb/d to 3,420 kb/d. The main contributors to the increase were North Dakota 17 kb/d, Colorado 12 kb/d and Wyoming 10 kb/d.
The main takeaway from The Rest chart is that current production is 632 kb/d below the high of October 2019 and this appears to be a permanent loss that will never be recovered.
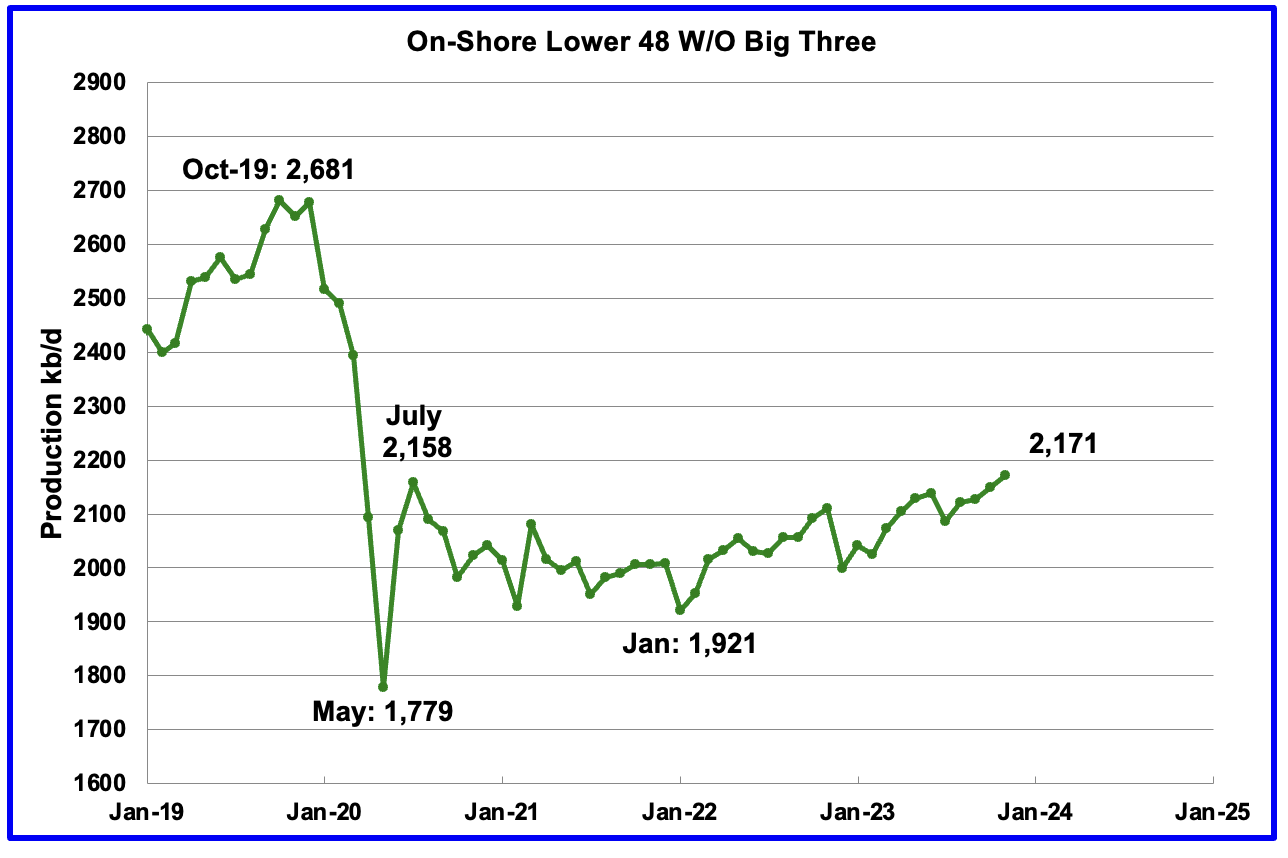
The On-Shore lower 48 W/O the big three, Texas, New Mexico and North Dakota, shows a slow rising trend from the low of January 2022. November’s production increased by 22 kb/d to 2,171 kb/d. The majority came from Colorado, 12 kb/d and Wyoming 10 kb/d. Production from these states has just exceeded the post covid production high of 2,158 kb/d in July 2020.
Rig report for week ending February 2
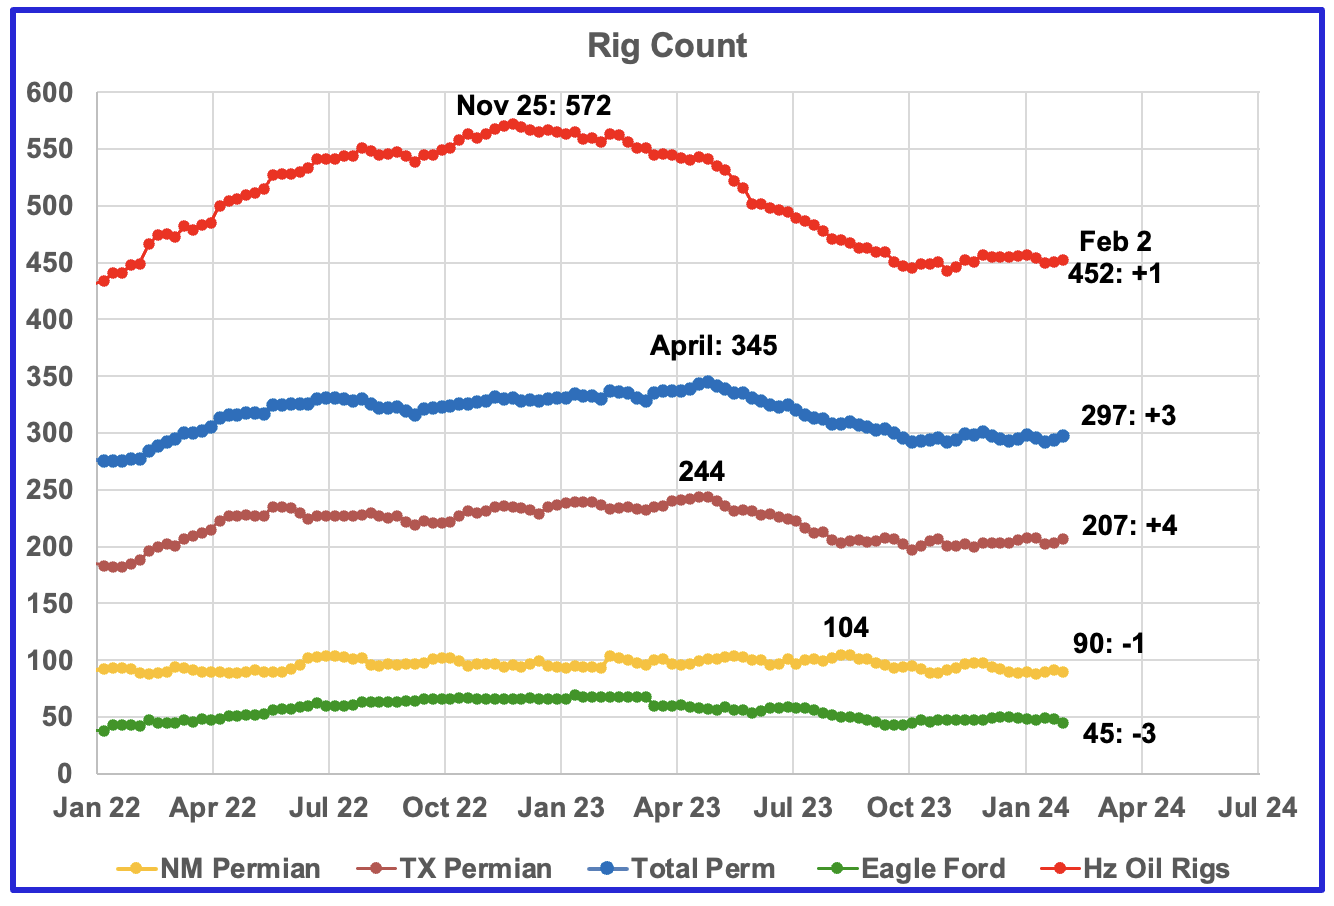
– US Hz oil rigs increased by 1 to 452. The rig count has been close to 450 since the beginning of October.
– Permian rigs were up 3 to 297. Texas Permian was up 4 to 207 while NM was down 1 to 90. In New Mexico, Lea county was down 4 to 40 while Eddy added 2 to 50.
– Eagle Ford dropped 3 to 45.
– NG Hz rigs declined by 2 to 105 (not shown)
Frac Spread Count for Week ending February 2
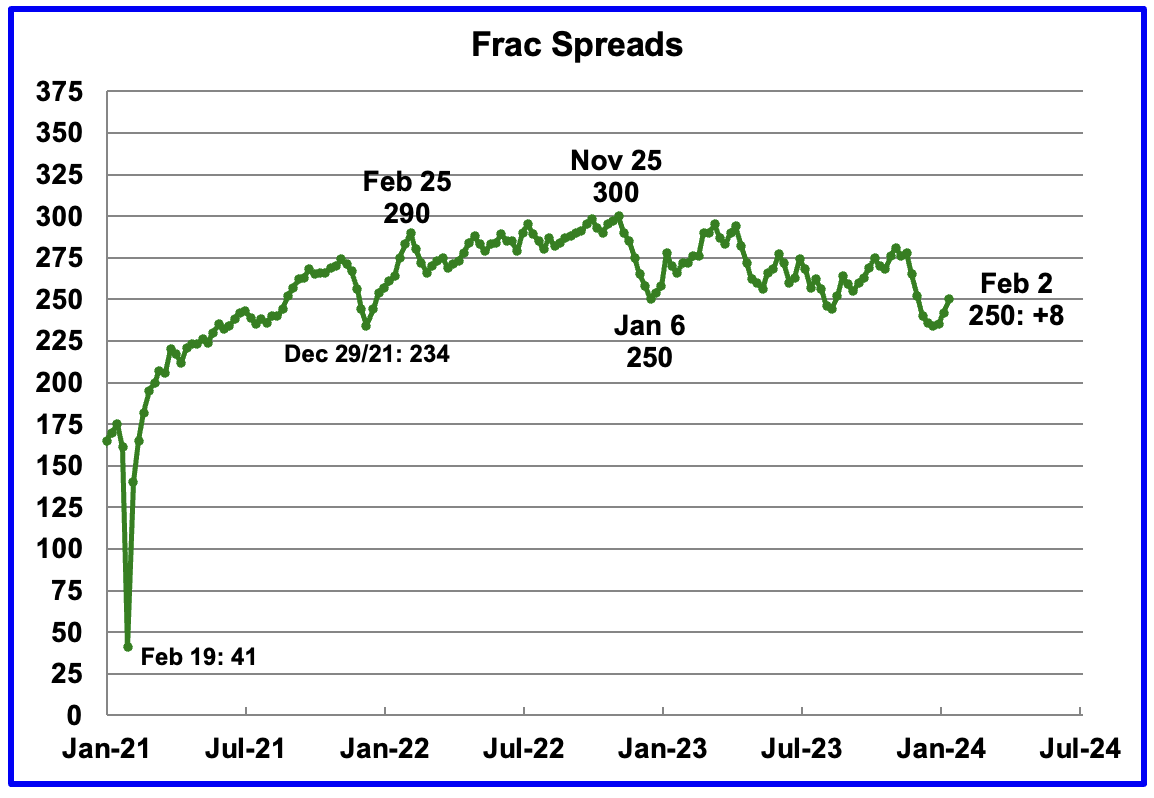
The frac spread count was up 8 to 250 and up 16 from the previous low of 234 on December 29, 2021. How high will the Frac count go in 2024?
Permian Basin Report by Main Counties and Districts
This special monthly Permian section was recently added to the US report because of a range of views on whether Permian production will continue to grow or will peak over the next year or two. The issue was brought into focus recently by the Goehring and Rozencwajg Report which indicated that a few of the biggest Permian oil producing counties were close to peaking or past peak. Also comments by posters on this site have similar beliefs from hands on experience.
This section will focus on the four largest oil producing counties in the Permian, Lea, Eddy, Midland and Martin. It will track the oil and natural gas production and the associated Gas Oil Ratio (GOR) on a monthly basis. The data is taken from the state’s government agencies for Texas and New Mexico. Typically the data for the latest two or three months is not complete and is revised upward as companies submit their updated information. Note the natural gas production shown in the charts that is used to calculate the GOR is the gas coming from both the gas and oil wells.
Of particular interest will be the charts which plot oil production vs GOR for a county to see if a particular characteristic develops that indicates the field is close to entering the bubble point phase. While the GOR metric is best suited for characterizing individual wells, counties with closely spaced horizontal wells may display a behaviour similar to individual wells due to pressure cross talking . For further information on the bubble point and GOR, there are a few good thoughts on the intricacies of the GOR in an earlier POB comment. Also check this EIA topic on GOR.
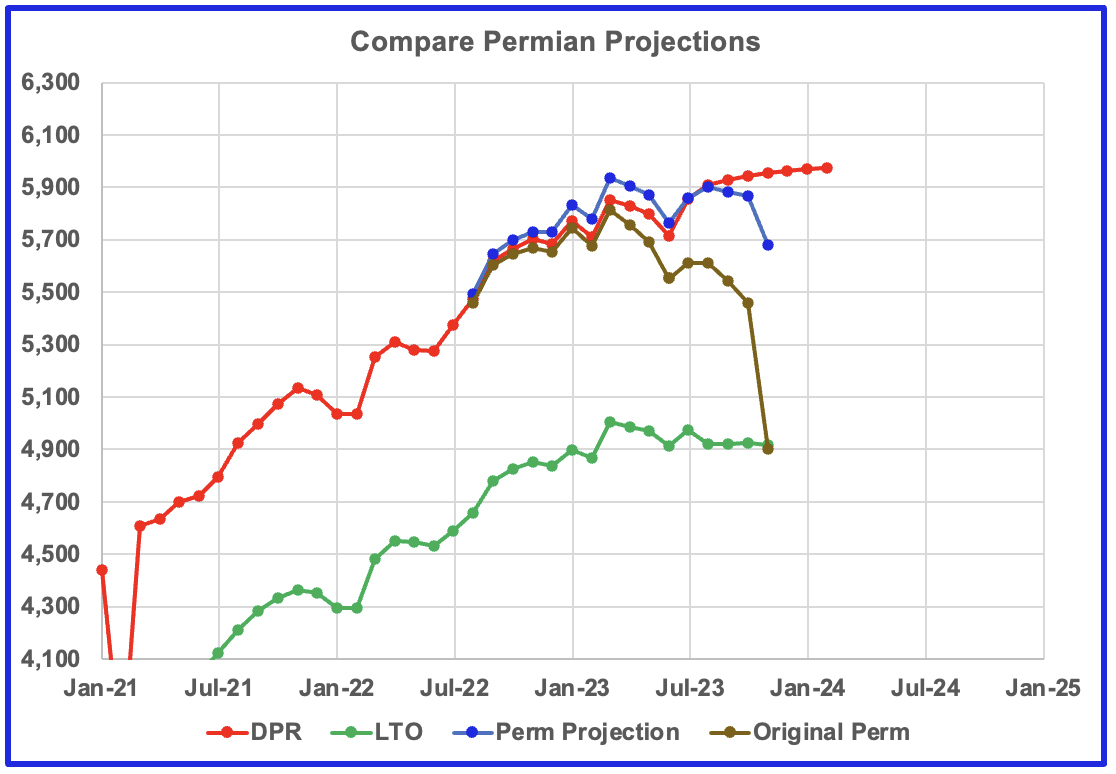
This chart shows four oil production graphs for the Permian basin updated to November and to February for the DPR. The gap between the DPR and LTO projections is there because the DPR projection includes both LTO oil along with oil from conventional wells in the basins that it covers.
The red and green graphs show oil production as published by the EIA’s DPR and the LTO offices. Comparing the two, it appears that the LTO office believes Permian LTO production is currently in a plateau phase while the DPR office continues to show a small increase in growth before plateauing. The blue marker is a projection. The brown chart is the sum of Permian production data from the Texas RRC and the New Mexico Oil Conservation Division. The big November drop is due to a larger than typical monthly production drop in the RRC data.
The blue graph only uses two months of production data from New Mexico OCD and the Texas RRC, October and November, to make its November projection. The blue graph is similar to the DPR and LTO graphs in the sense that it is also indicating that Permian production may be entering a plateau phase.
New Mexico Permian
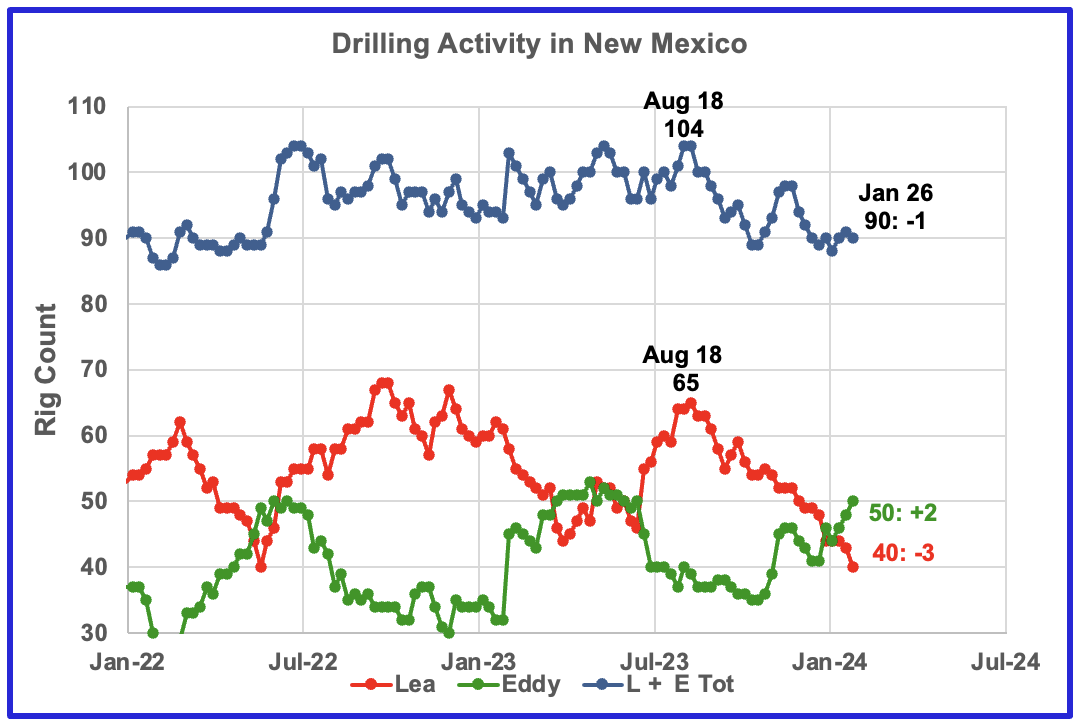
Over the past six months drilling activity in Lea county has fallen each month. For the week ending February 2, the rig count in Lea dropped by three while Eddy added two. Since the middle of August, the Lea county rig count has dropped from 65 rigs to 40 rigs in Januuary 2024. At the same time November production in Lea county increased by 59 kb/d, see next chart.
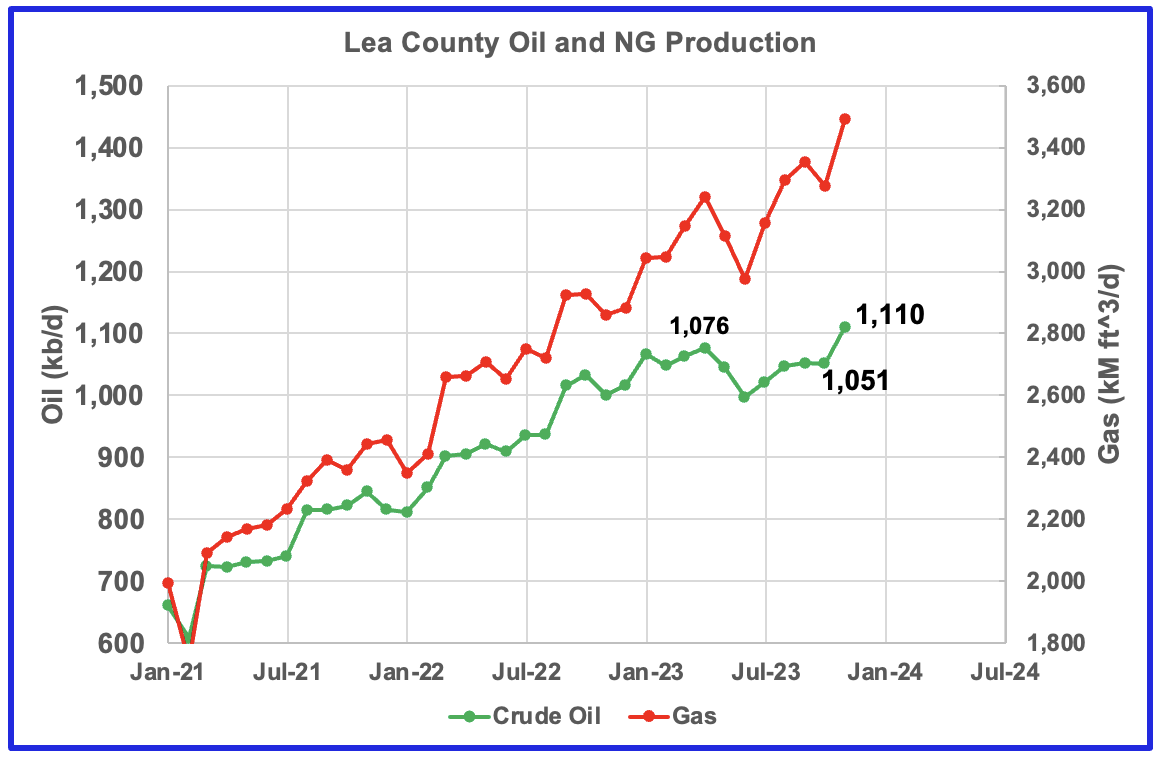
From June 2023 to September 2023 NG production rose faster than oil production in Lea county. However November saw both record NG and oil production and the GOR stayed in the same range as the past three months, see next chart.
November oil production increased by 59 kb/d to a record 1,110 kb/d even though the rig count dropped by 25 rigs since August 18. Assuming the average spud to production time is 6 months, that implies a small number of new wells could have started producing in 4 to 5 months. In other words, the November production increase must be associated with a number of June 2023 drilled wells coming online in November. That being the case, the production increase in Lea could increase for another month before starting to decline, assuming that production should follow the dropping rig count, delayed by 4 to 8 months.
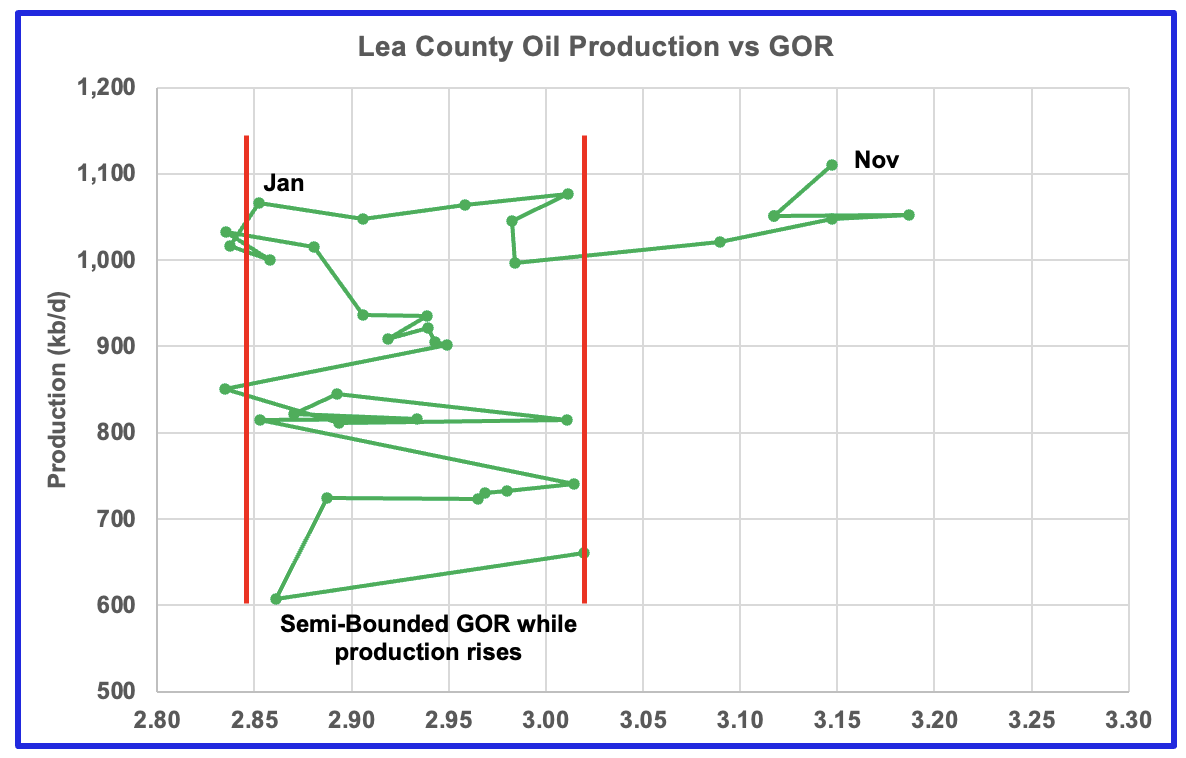
After much zigging and zagging, oil production in Lea county stabilized above 1,000 kb/d. The GOR and oil production both increased in January 2023. November oil production in Lea county hit a new high of 1,110 kb/d. The data for the last four months, August to November, is incomplete and will be updated over the next few months.
This zigging and zagging GOR pattern within a semi-bounded GOR while oil production increases to some stable level and then moves out to a higher GOR to the right has shown up in a number of counties. See an additional two cases below. While this is the fifth month in which Lea county has registered a GOR outside the semi-bounded GOR range, the November trend has changed since both production and the GOR have increased. As noted above the increase must be related to the significant increase in drilling that started in mid June.
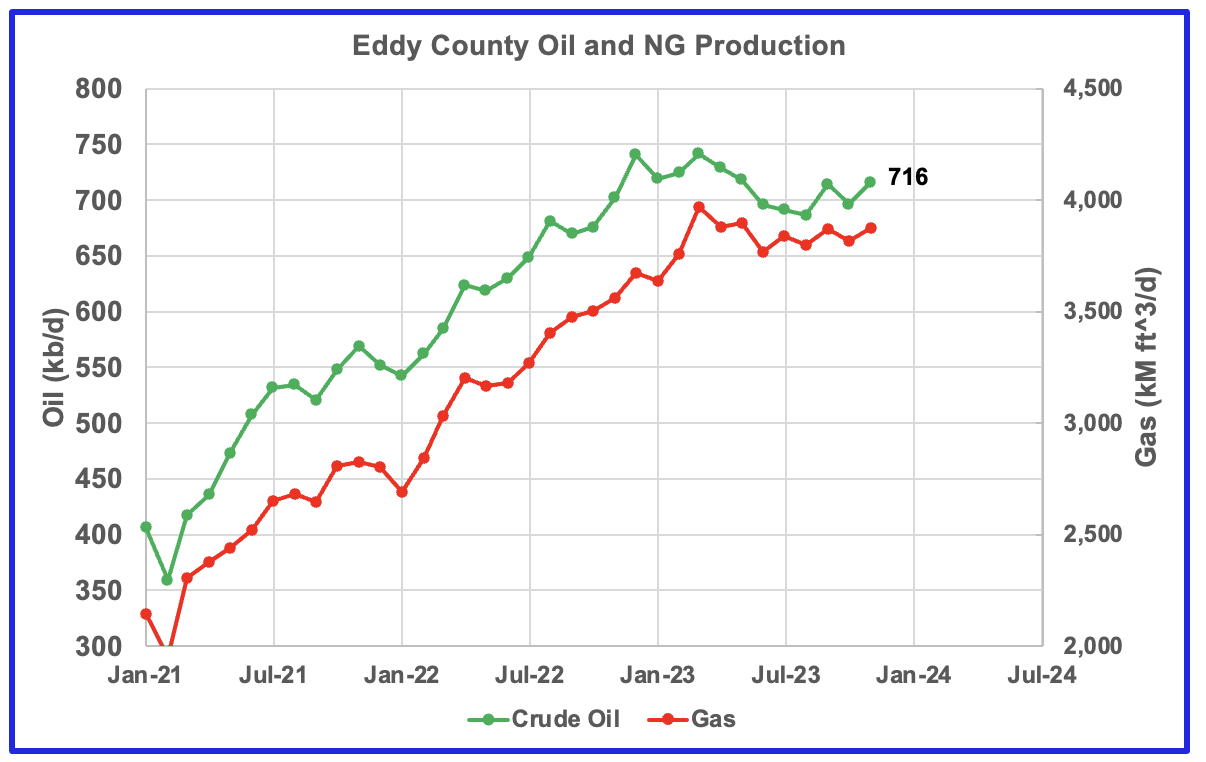
Eddy county oil production is showing early signs that it is in a plateau phase. November production was 716 kb/d.
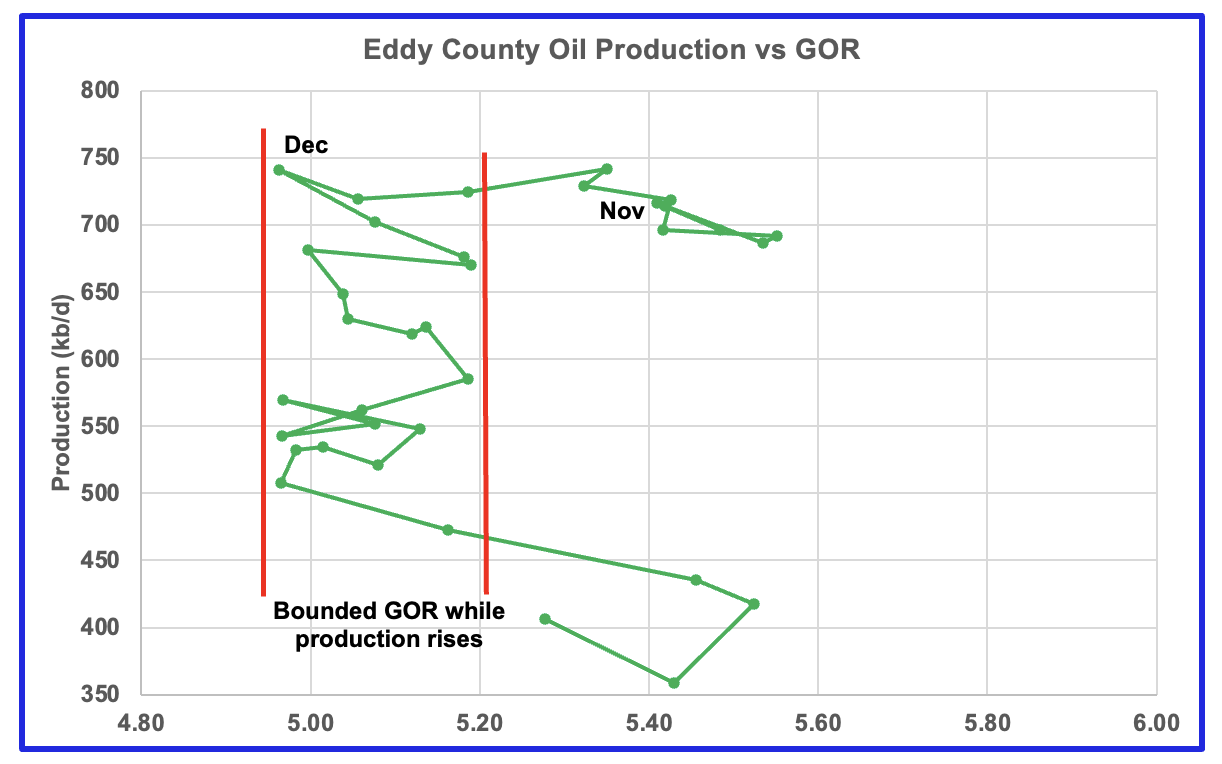
The Eddy county GOR pattern is similar to Lea county except that Eddy broke out from the semi bounded range earlier and for a longer period while oil production has been bouncing around the 700 kb/d level.
Texas Permian
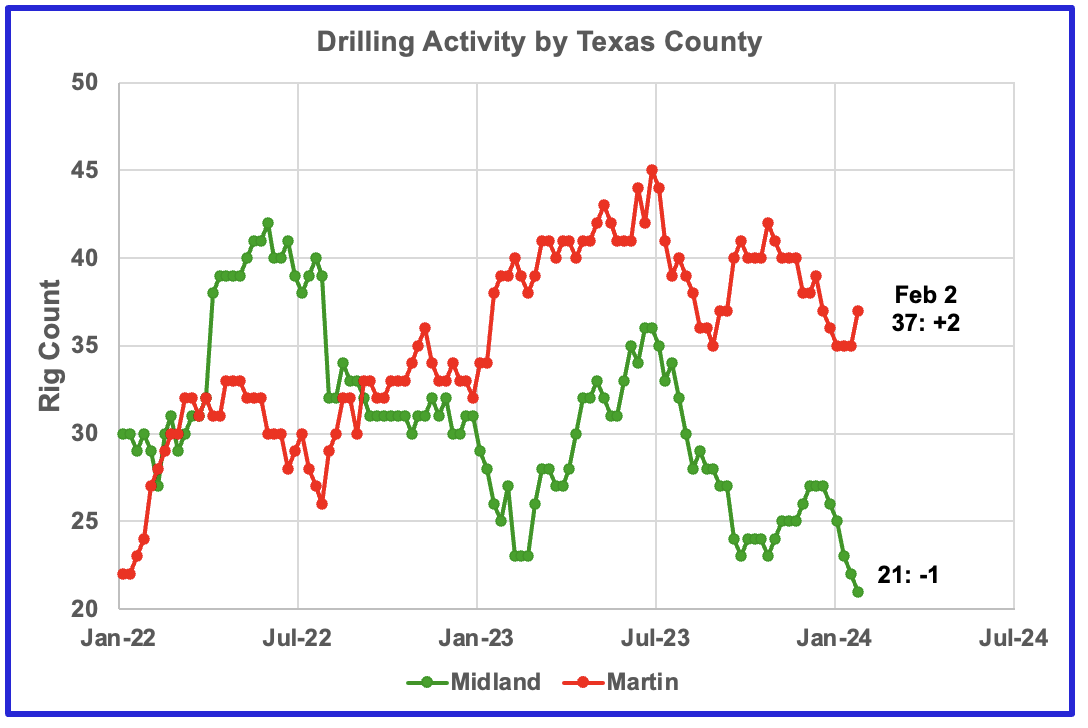
During December 2023 drilling activity started to decrease in both counties and continued into January. However the rig count increased in Martin county in early February.
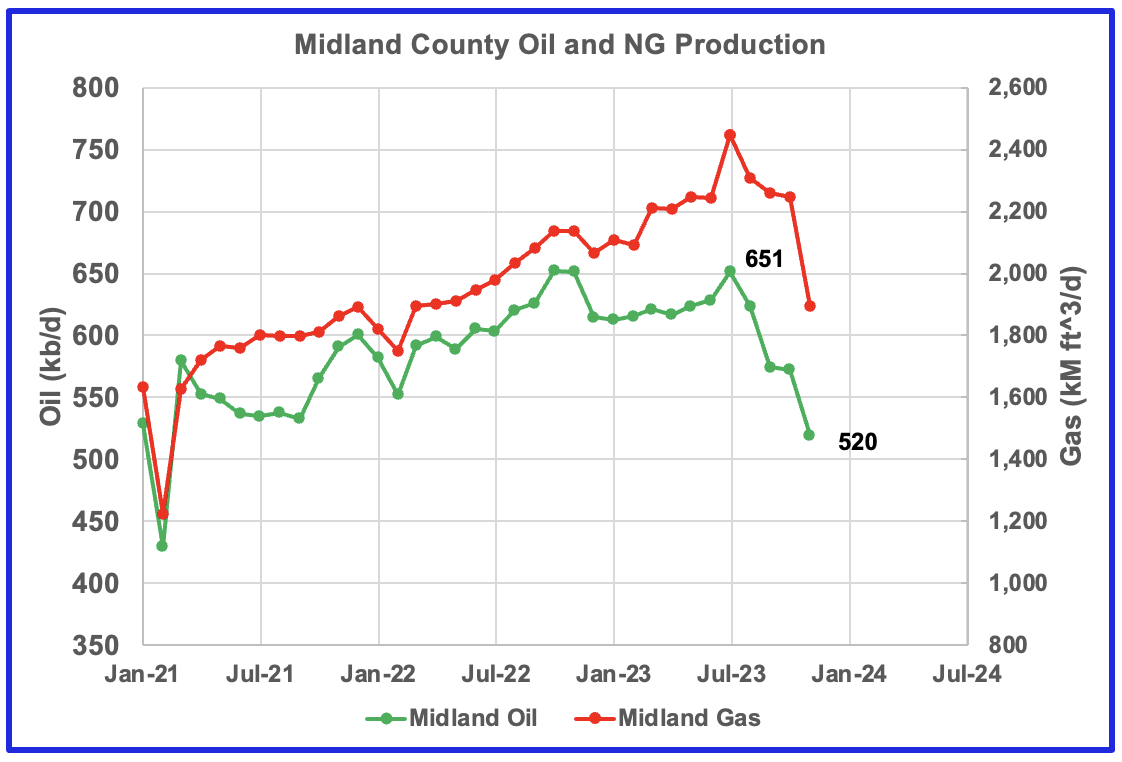
Both natural gas and oil production are dropping in Midland county. November Oil production has dropped by 131 kb/d to 520 kb/d since July 2023.
Comparing the drop in production with the rig count, one could speculate that the drilling peak in June 2022 could account for the July 2023 oil production peak. Note the sharp drop in the rig count at the end of July 2022 which could explain the rapid drop in Midland production that started in July 2023.
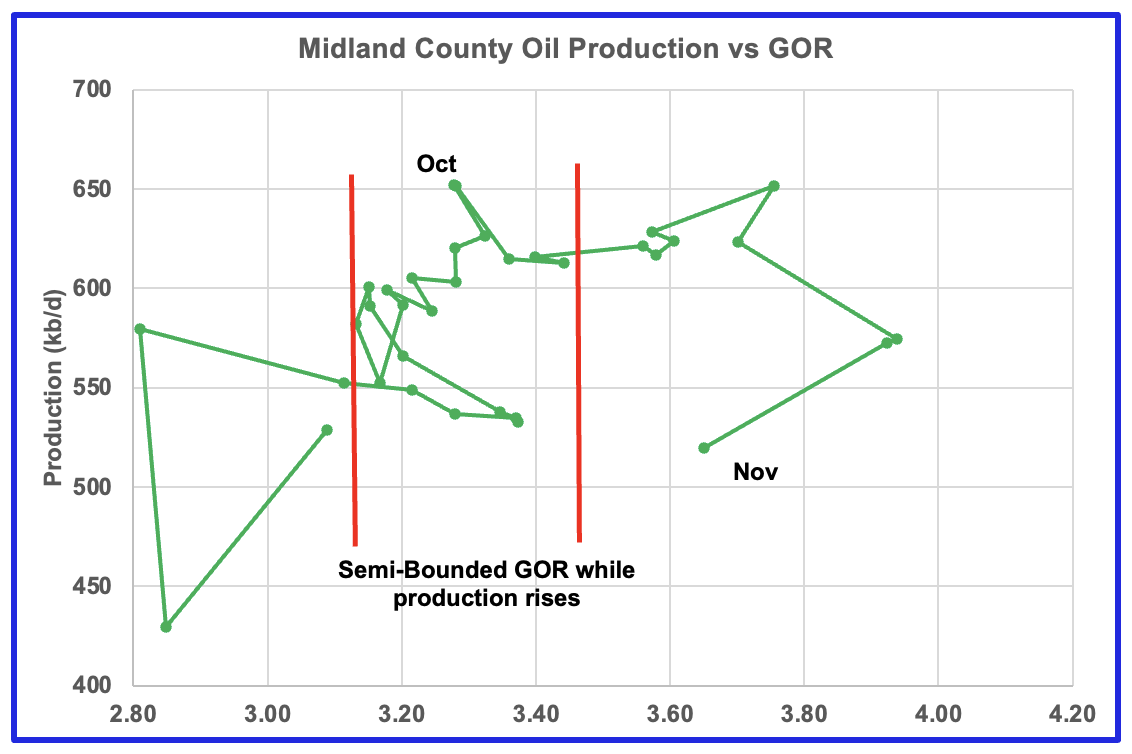
Oil production is dropping and the GOR is increasing. It appears that Midland has entered the bubble point phase?
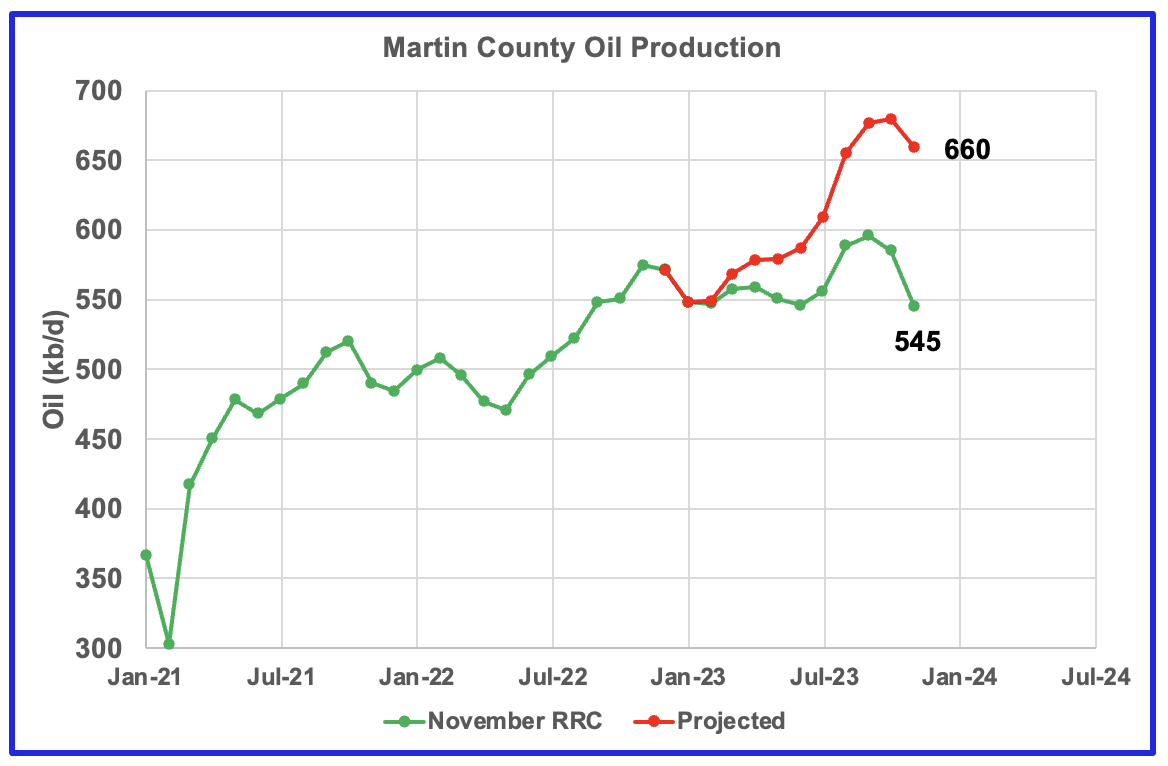
The chart shows the RRC oil production for Martin County along with how the RRC could be reporting November 2023 production about one year from now.
The red line is a production forecast which the Texas RRC will be reporting for Martin county about one year from now as drillers report additional updated production information. This projection is based on a methodology that used October and November production data and will be re-estimated next month.
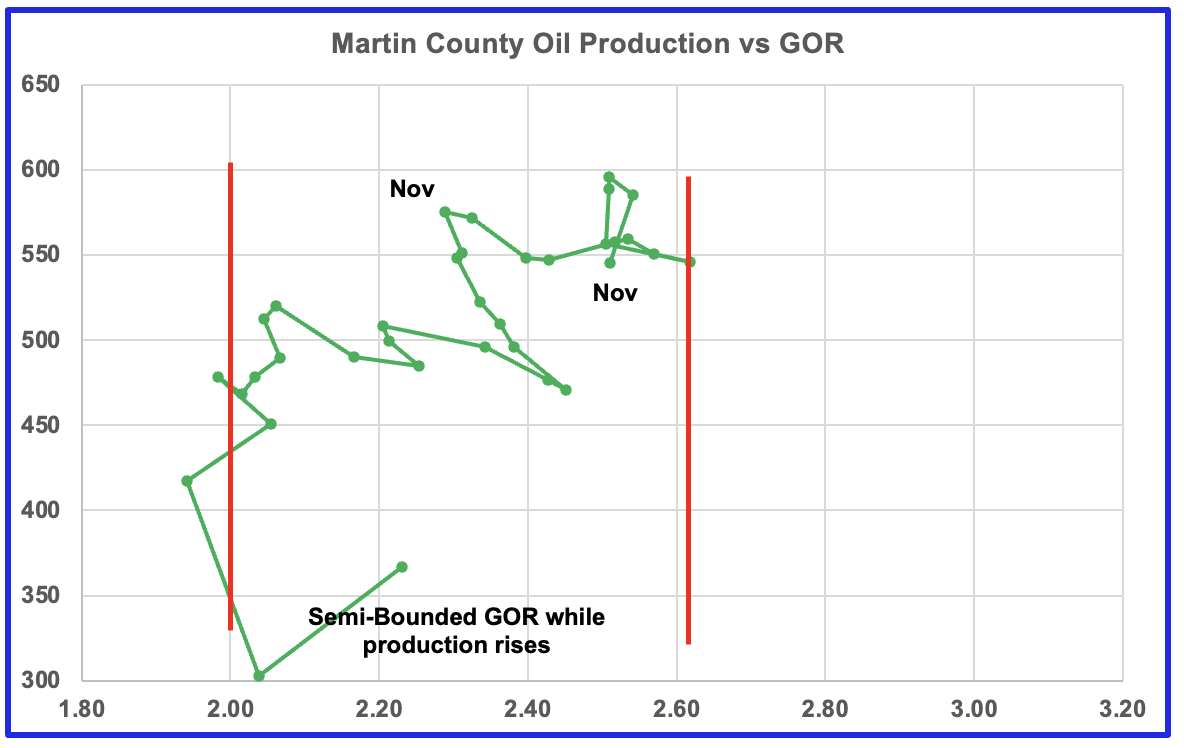
Martin county’s production and GOR continue to stay within the semi bounded range and near peak production. Martin county has the lowest GOR of these four counties at a GOR of 2.51. Martin may not be at the bubble point that results in a dropping oil production trend.
Three of the four oil production vs GOR charts above are exhibiting characteristics indicating that three of the largest oil producing counties in the Permian are in the bubble point phase and are close to or past their peak? Not clear as to what is happening in Martin County.
The production data reported by the RRC this month appears to be a little more under reported than previous months. While there are other indicators pointing to an upcoming peak in Permian oil production, such as the declining rig count, a few more months of data is required.
Eagle Ford Basin Largest County
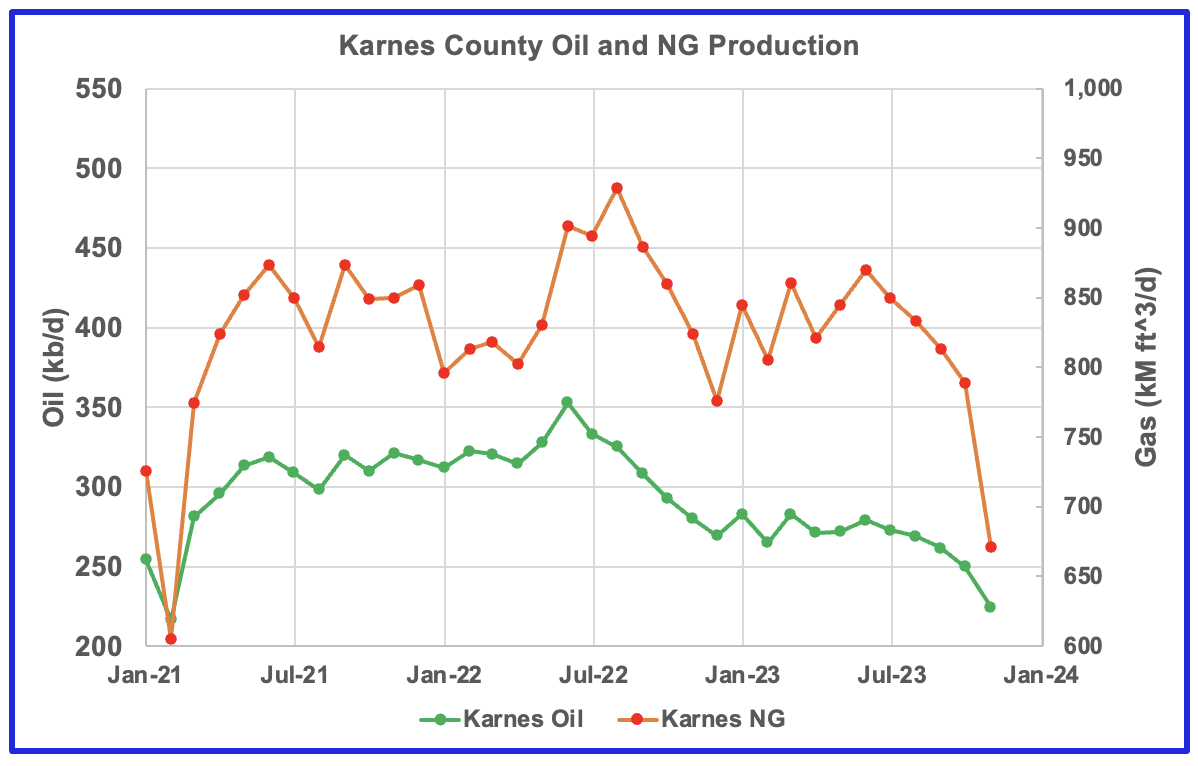
Karnes county is the biggest oil producing county in the Eagle Ford basin and is ranked as the seventh largest oil producing county in Texas. Both oil and gas production are falling in Karnes county and both are down close to 30% from the peak.
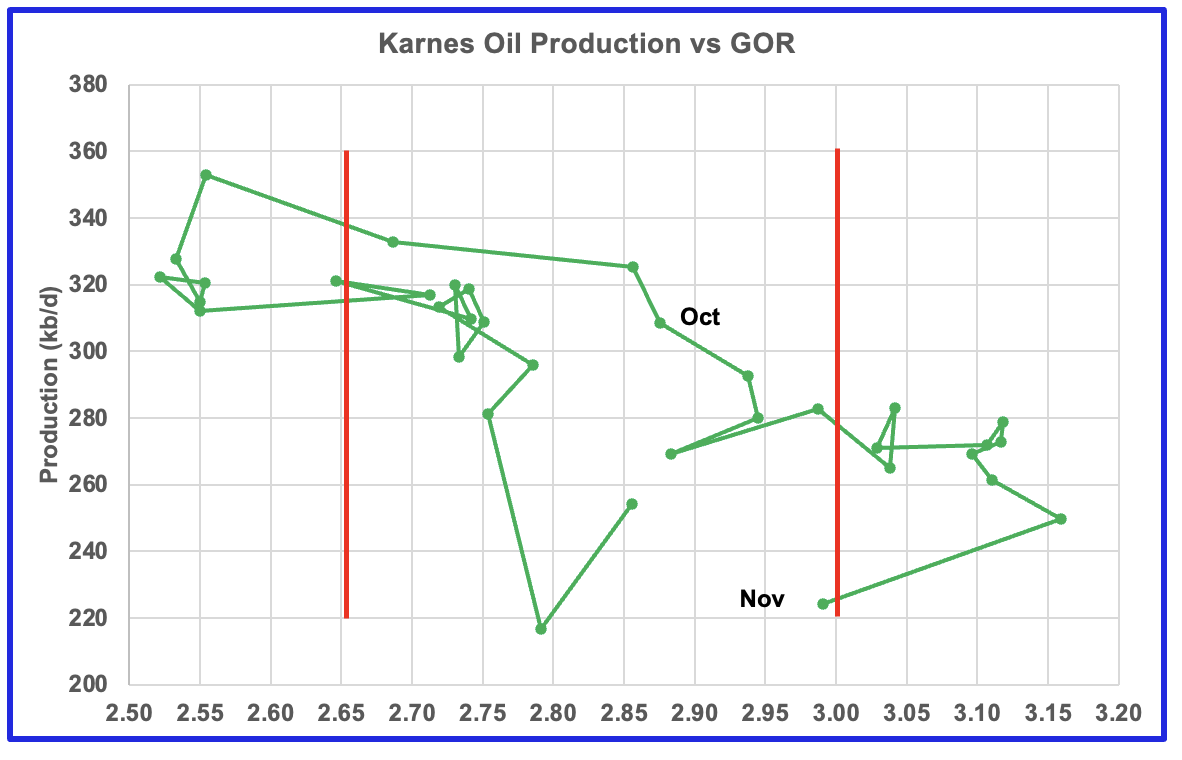
This is the GOR vs oil production chart for Karnes county but the GOR is still within its typical range while both oil production and GOR are dropping. This may indicate that Karnes county wells never entered the bubble point phase and weren’t very gassy to start with. Karnes county ranks fifteen in Texas natural gas production.
Drilling Productivity Report
The Drilling Productivity Report (DPR) uses recent data on the total number of drilling rigs in operation along with estimates of drilling productivity and estimated changes in production from existing oil wells to provide estimated changes in oil production for the principal tight oil regions. The January DPR report forecasts production to February 2024 and the following charts are updated to February 2024. The DUC charts and Drilled Wells charts are updated to December 2023.
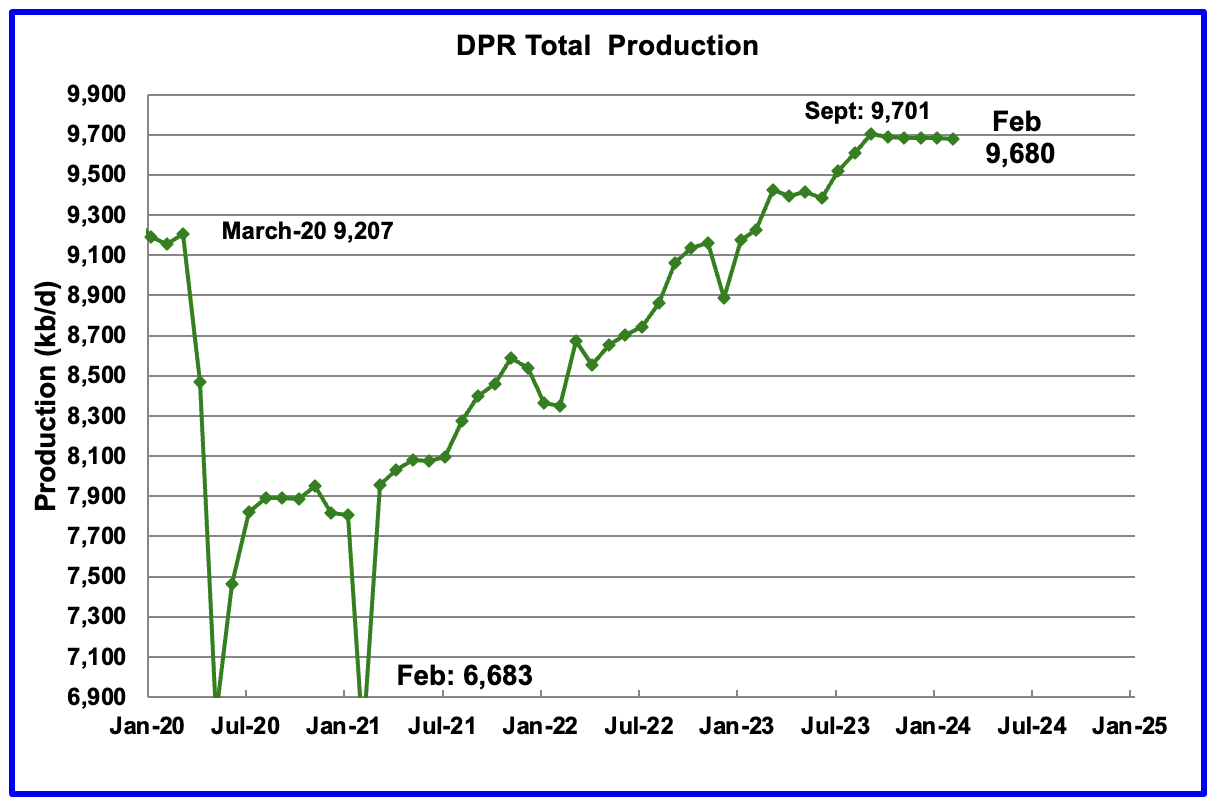
Above is the total oil production projected to February 2024 for the 7 DPR basins that the EIA tracks. Note that DPR production includes both LTO oil and oil from conventional wells.
The DPR is projecting that oil output for February 2024 will decrease by 1 kb/d to 9,680 kb/d.
While DPR production has been essentially flat since September, the February report also made a downward revision to its previous production forecast. For January, DPR production was revised down by 11 kb/d to 9,681 kb/d. Previous revisions over the past few months were upward.
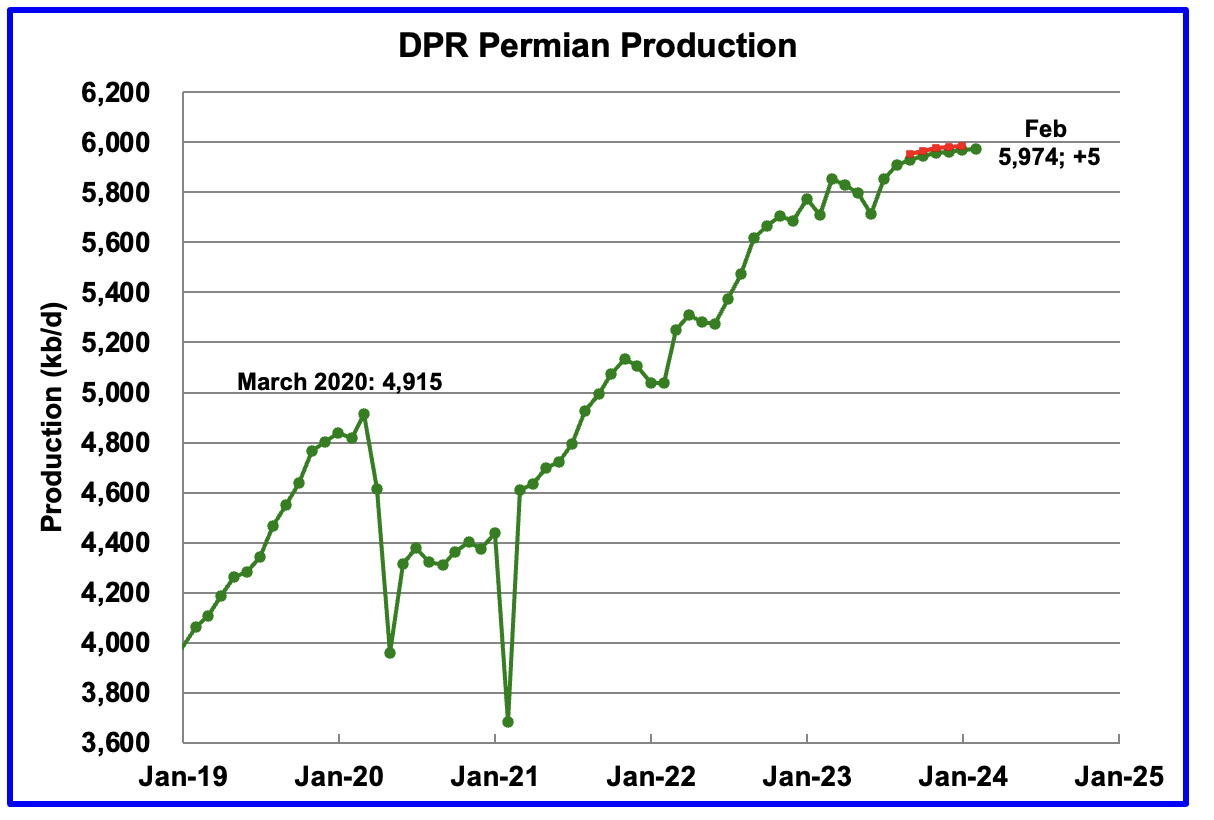
According to the EIA’s January DPR report, Permian output will continue its slow rise in February. It is expected to increase by 5 kb/d to 5,974 kb/d. The last five months of production data clearly show a dropping trend in monthly production growth.
The red markers show the DPR’s previous December forecast. For January, Permian production was lowered by 17 kb/d from 5,986 kb/d to 5,969 kb/d.
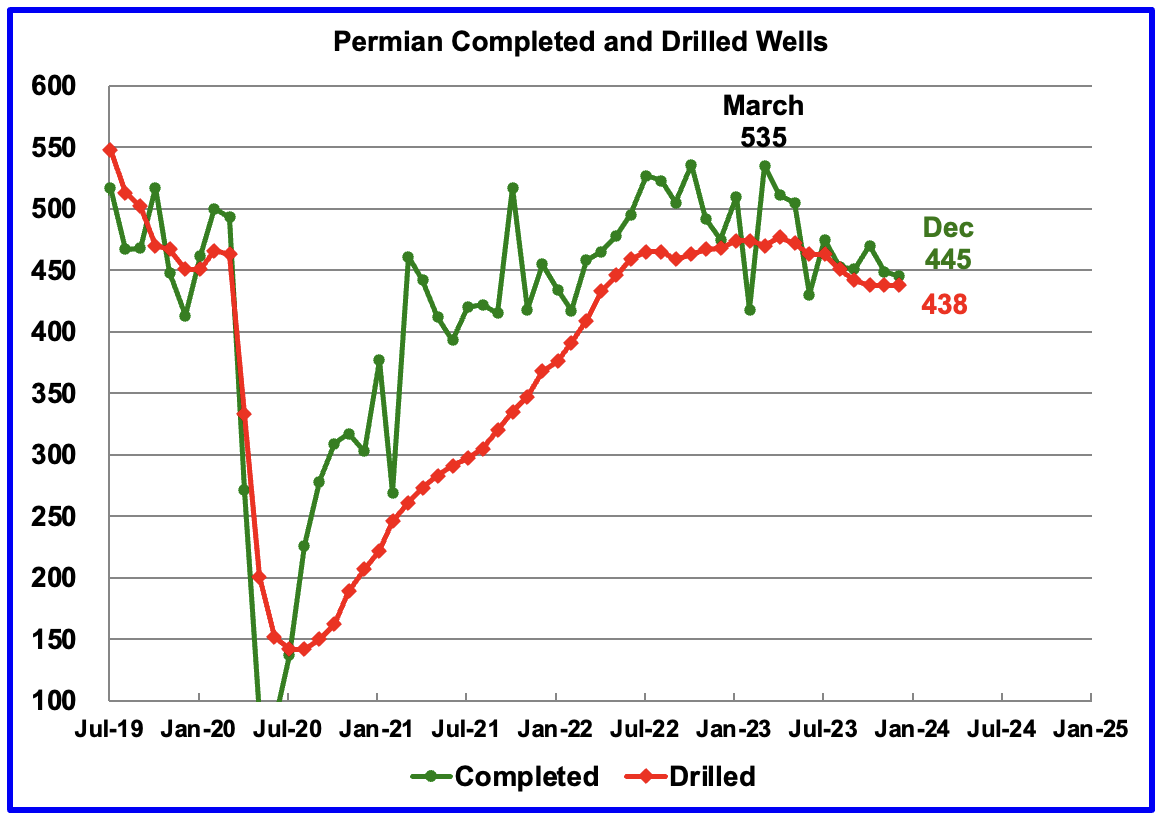
During December, 438 wells were drilled and 445 were completed in the Permian. (Note that December is the latest month for DUC information). The completed wells added 410 kb/d to December’s output for an average of 922 b/d/well. The overall decline was 403 kb/d which resulted in a net increase to Permian output in December of 6.5 kb/d. Of the 445 completed wells in December 438 were required to offset the decline. Those extra 7 completed wells producing at 922 b/d resulted in the 6.5 kb/d increase in December.
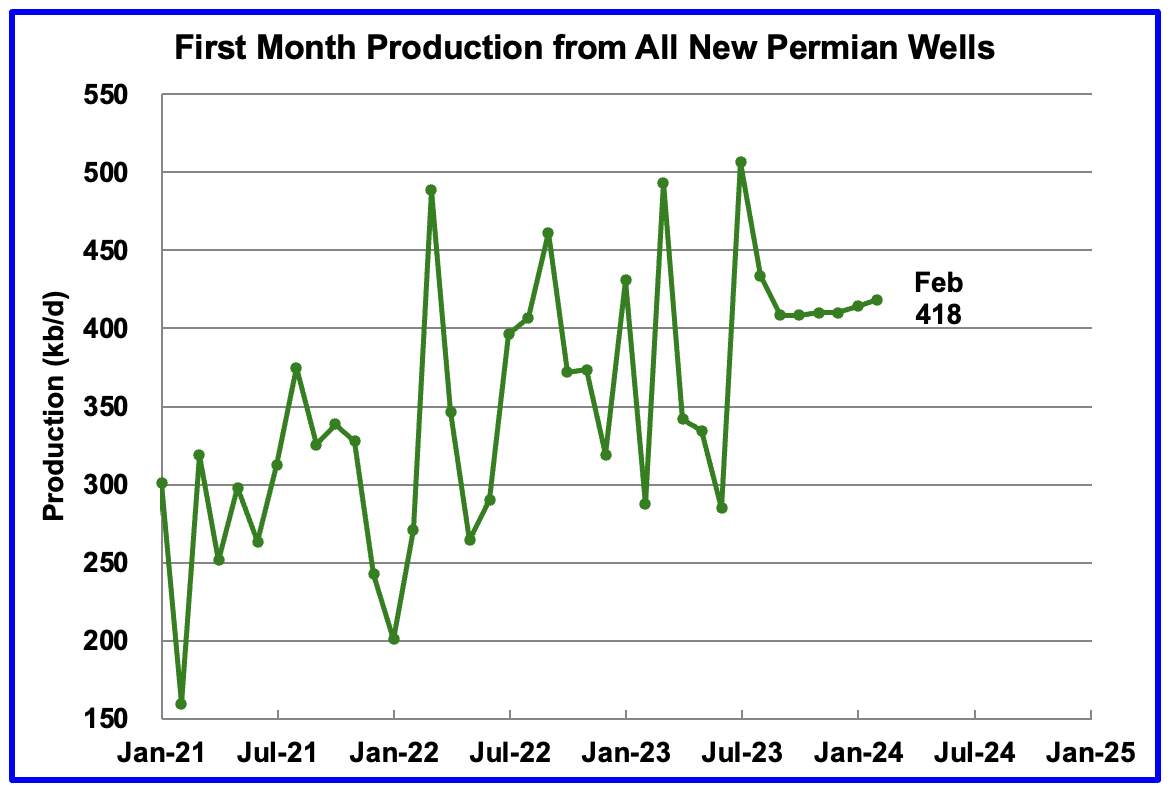
This chart shows the average first month total production from Permian wells tracked on a monthly basis. The total monthly production from the newest Permian wells in February is expected to be 418 kb/d, 4 kb/d higher than January.
Recall that this production of 418 kb/d is offset by a decline of 413 kb/d for a net overall output increase in the Permian basin of 5 kb/d, the smallest recent monthly increase. This all hints at slowing production growth in the Permian.
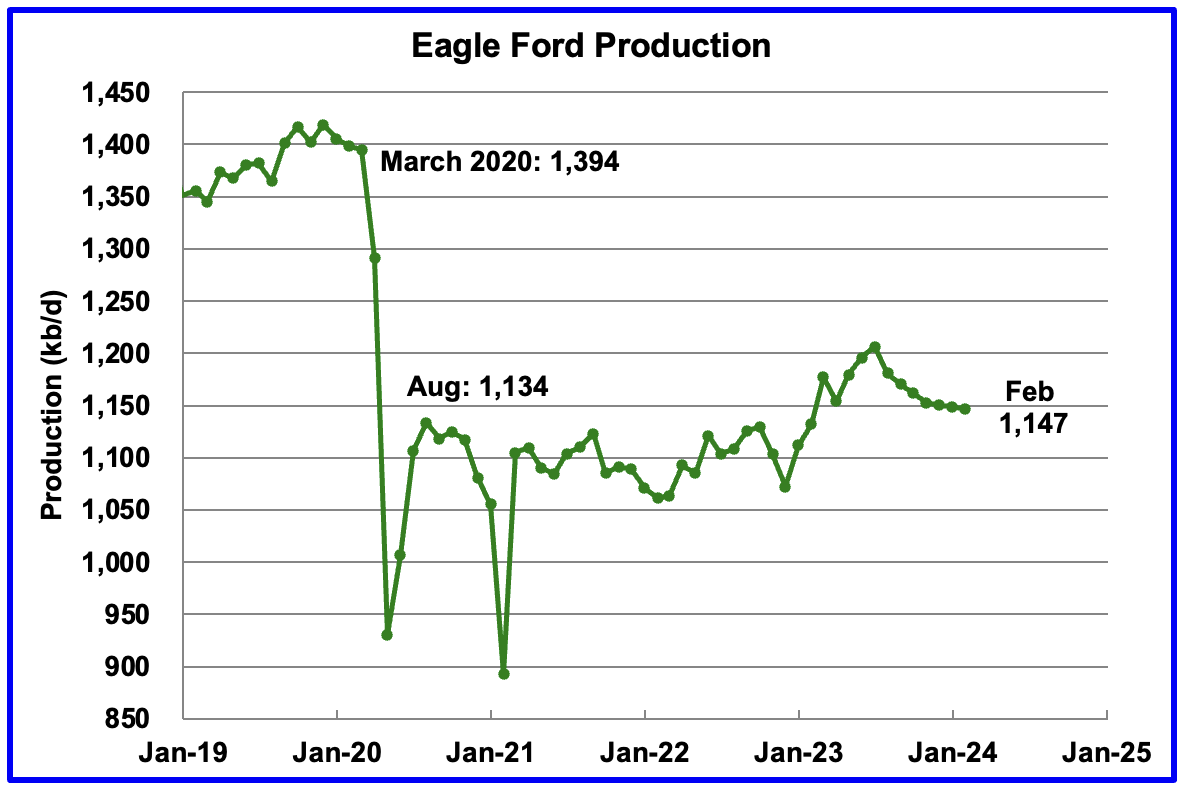
Output in the Eagle Ford basin has been in a downtrend since August. The DPR’s January’s forecast projects February output to decrease by 2 kb/d to 1,147 kb/d. The Eagle Ford’s output for January was not revised in the February report.
At the beginning of the year 2023, 68 rigs were operating in the Eagle Ford basin. The rig count began to drop in mid March 2023 to 60 and slowly dropped further to 47 in November 2023. Since late October 2023 the Eagle Ford rig count has been close to 48 ± 2 rigs.
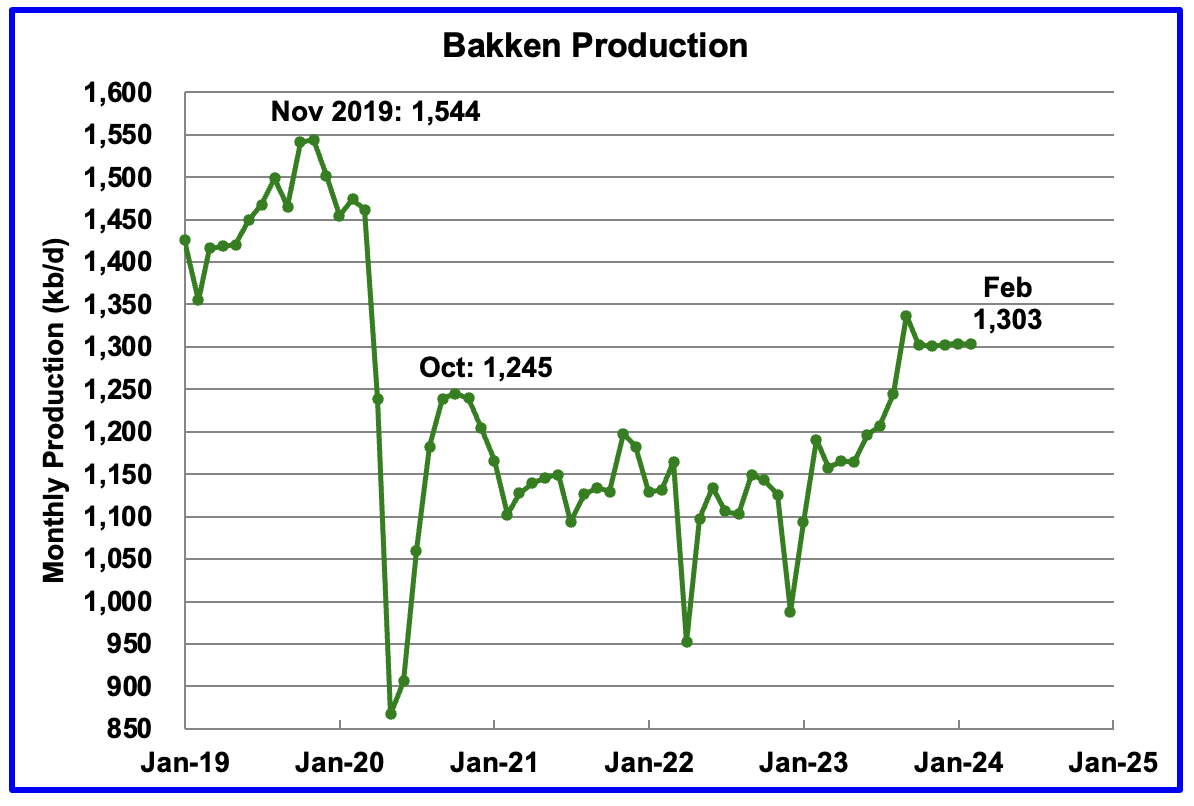
The DPR forecasts Bakken output in February will be 1,303 kb/d, 1 kb/d Lower than January. February 2024 production is now projected to be 58 kb/d higher than the post pandemic peak of 1,245 kb/d in October 2020.
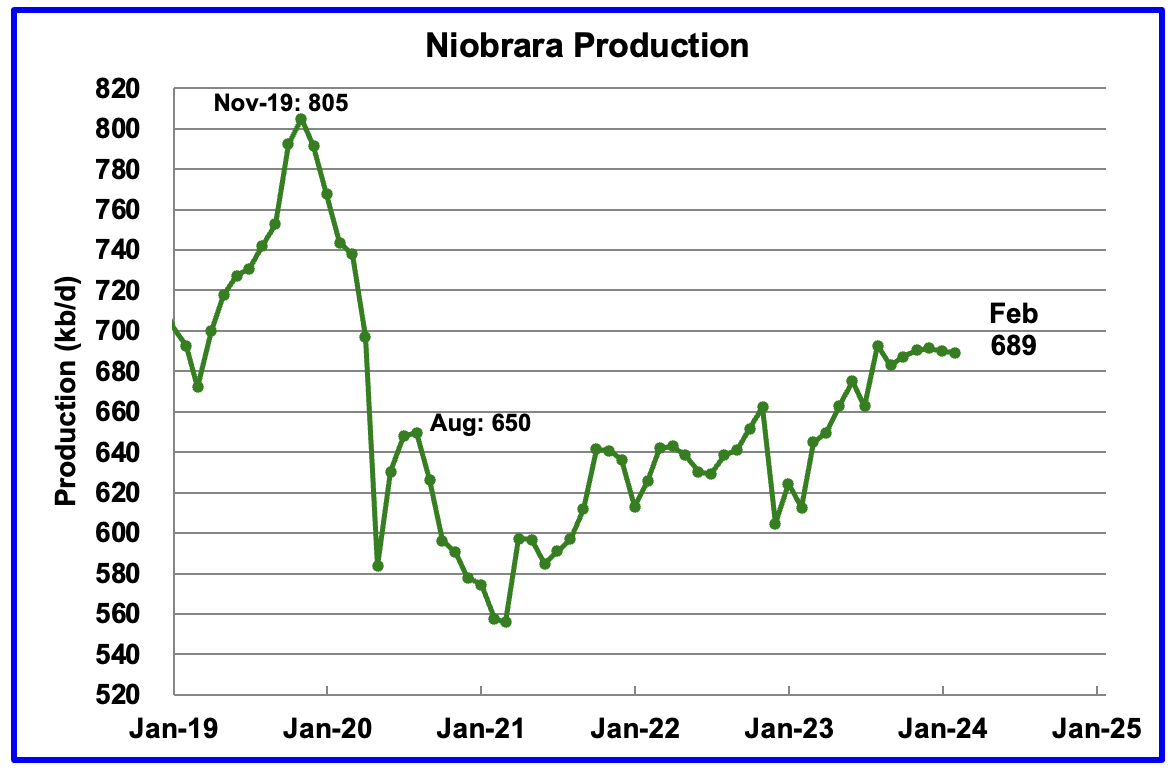
Output growth in the Niobrara continues to slow. February’s output decreased by 1 kb/d to 649 kb/d.
Production increased starting in January 2023 due to the addition of rigs into the basin but stabilized at 16 ± 1 rigs in March and April. However while from August to December, the rig count has held steady at 14, January has seen the rig count drop by 2 to 12. The drop in production has been slowed by the increased use of DUCs, 29 in December. See next section.
DUCs and Drilled Wells
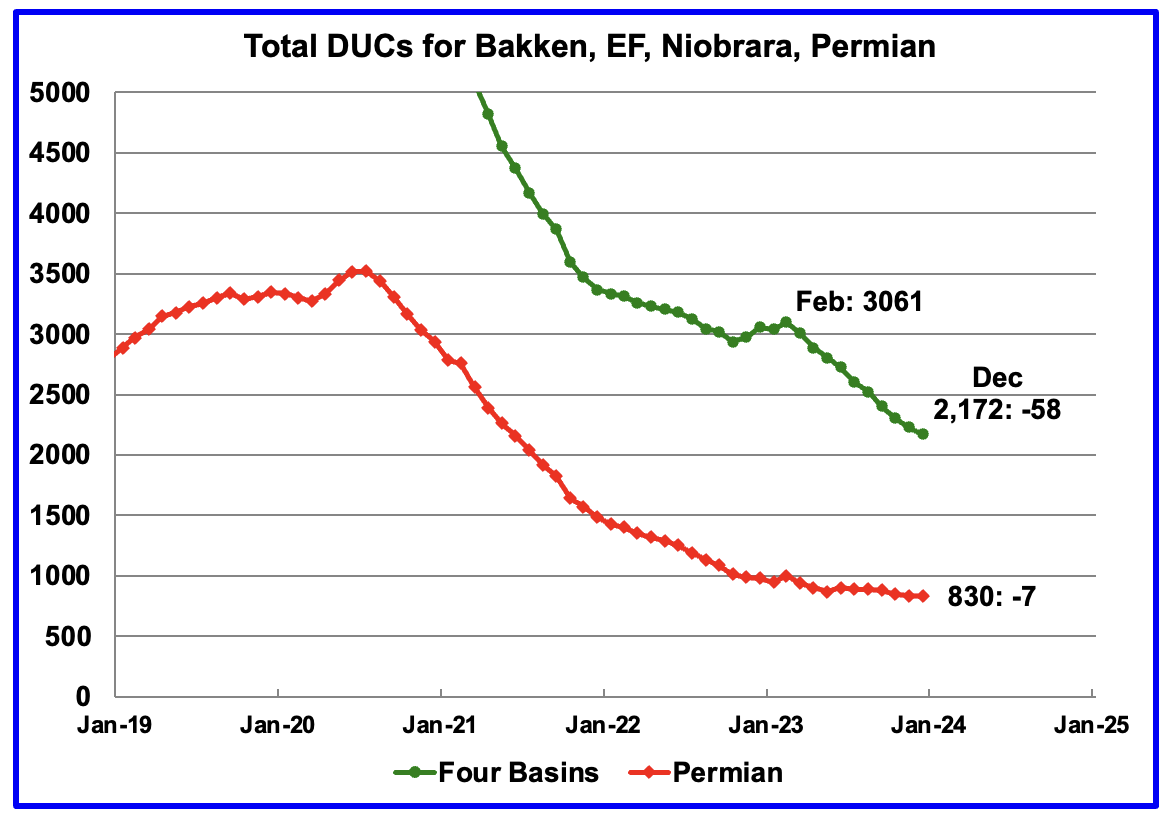
The number of DUCs available for completion in the Permian and the four major DPR oil basins has fallen every month since July 2020. December DUCs decreased by 58 to 2,172. The average DUC decline rate since March has been 89 DUCs/mth but appears to be slowing. Of the 58 DUC decrease in December, 29 came from the Niobrara. The average DUC decline rate over the past 6 months in the Niobrara has been 29 DUCs per month. Without this high completion rate, the production drop shown in the Niobrara chart would have been higher.
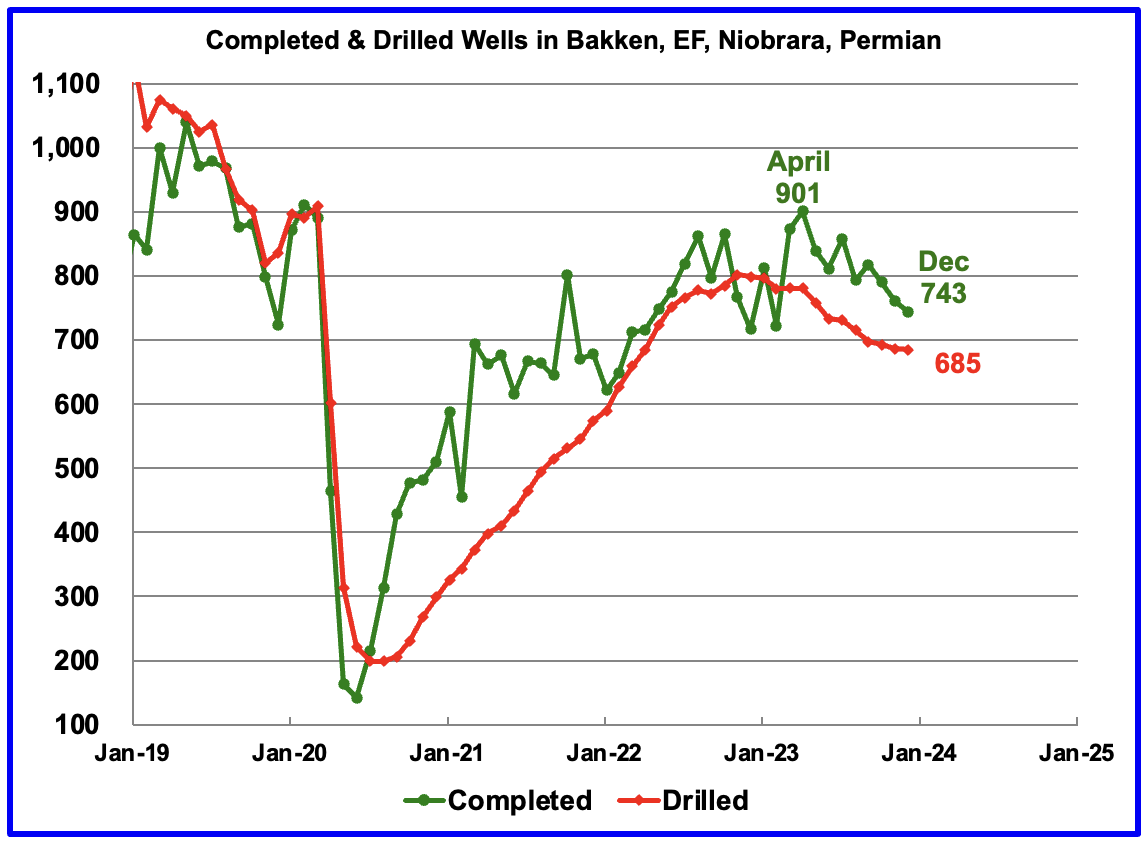
In these 4 basins, 743 wells were completed while 685 were drilled. Both drilled wells and completions are down from higher levels in early 2023.
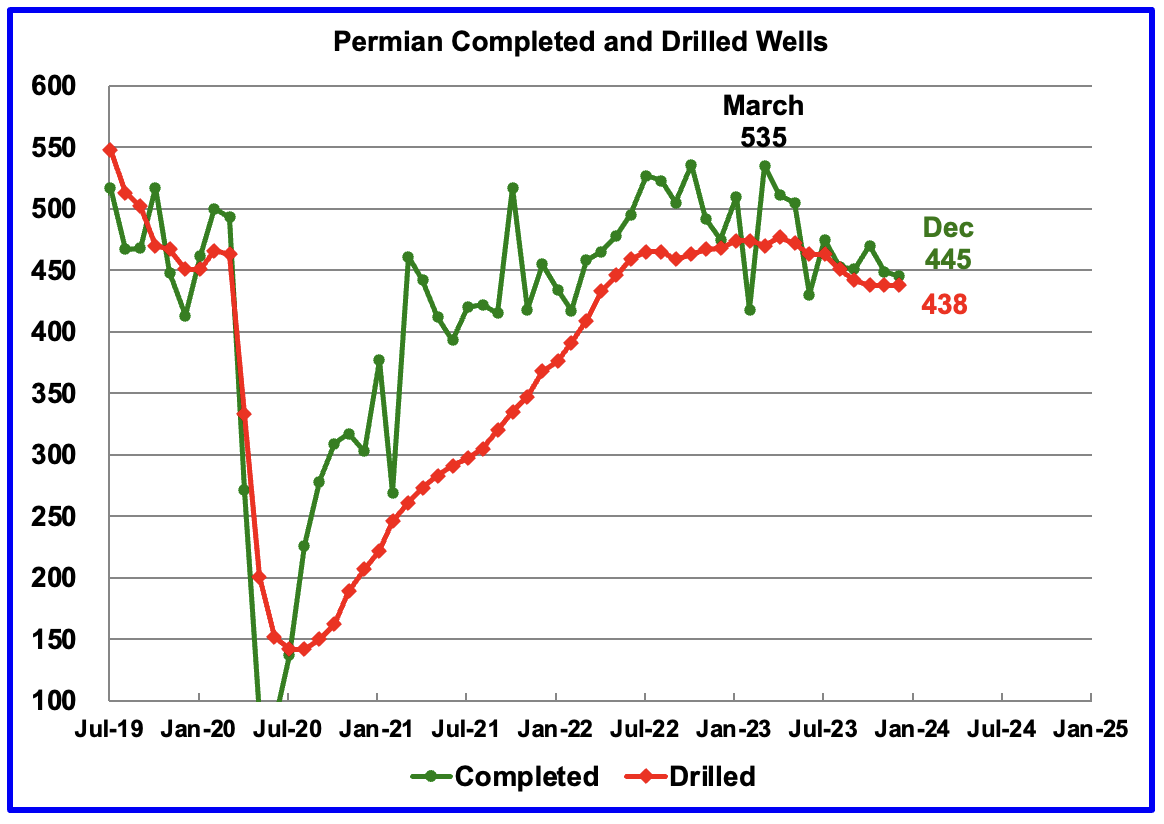
In the Permian, the monthly completion and drilling rates have been slowing since the March 2023 high of 535 rigs.
In December 2023, 445 wells were completed while 438 new wells were drilled. The gap between completed and drilled wells in the Permian is now very small compared to late 2022 and early 2023. Regardless, it is those extra completions that increase Permian production.
A discussion last month on this board overwhelmingly decided that a more realistic DUC count for the Permian would be closer to under 100. That being the case, the 830 being reported by the DPR, if correct, must include a significant number of dead DUCs that will never be completed. An indicator of true number of viable DUCs in the Permian may be gleaned from the recent monthly completion rate.
- August: 2
- September 9
- October 32
- November 11
- December 7
While October is showing 32 DUCs were used, the original post on October completions reported 11. The 32 appears to be an outlier and data revision is being used to accommodate the current data.